
Critical Path Method (CPM) Explained: A Project Manager's Guide
Step-by-step Critical Path Method guide with worked example, network diagram, and float calculations. Find the longest path through your project network in minutes.
The Critical Path Method is a scheduling technique that identifies the longest sequence of dependent tasks in a project. This sequence, the critical path, determines the shortest possible duration for the project. Any delay on a critical path task delays the entire project.
Developed in the late 1950s by DuPont and Remington Rand for managing industrial projects, CPM remains one of the most important tools in a project manager's arsenal. If you manage projects with deadlines and dependencies, understanding CPM isn't optional; it's essential.
TL;DR: Critical Path in 30 seconds
- Critical path = the longest chain of dependent tasks. Sets the project's minimum duration.
- Float (slack) = days a task can slip without delaying the project. Critical tasks have zero.
- To find it: forward pass (earliest dates) → backward pass (latest dates) → float = LS − ES.
- To shorten the project: only "crash" tasks on the critical path. Adding resources elsewhere does nothing.
- To survive it: track float erosion weekly. Near-critical paths become critical the moment something slips.
Why the Critical Path Matters
Imagine you're managing a project with 50 tasks. Some can run in parallel. Some must wait for others. Without CPM, you might panic when any task runs late. With CPM, you know exactly which delays matter and which don't.
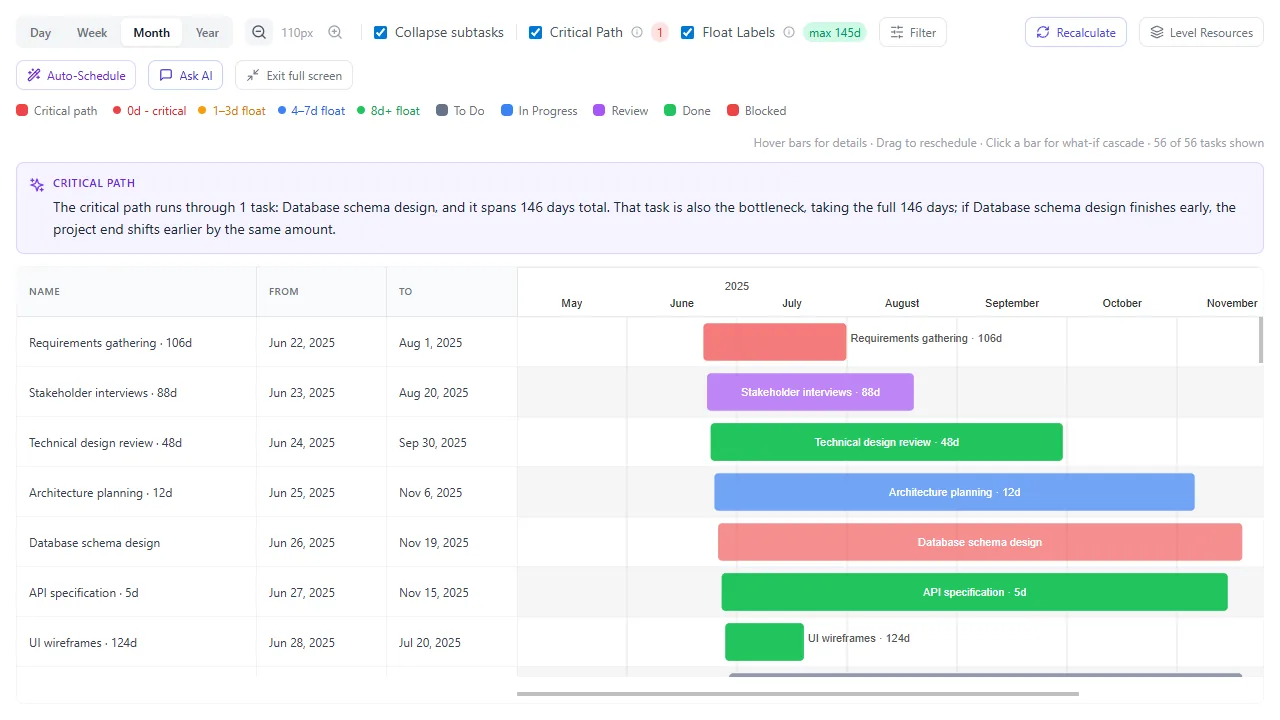
Onplana surfaces the critical path inline on the Gantt with float bands on every non-critical task and an AI bottleneck narrative naming which slip will push the end date.
The critical path tells you:
- The minimum time to complete the project
- Which tasks absolutely cannot slip without delaying the project end date
- Where you have scheduling flexibility (float/slack)
- Where to focus management attention and resources
Real-world impact: A task with 10 days of float running 3 days late? No problem, you still have 7 days of buffer. A critical path task running 1 day late? The project end date just moved.
Key Concepts
Activity
A task or piece of work with a defined duration. In CPM, activities consume time and often resources.
Dependency (Precedence Relationship)
A logical relationship between tasks. The most common is Finish-to-Start: Task B cannot begin until Task A is complete.
Path
A sequence of dependent tasks from the project start to the project end. Most projects have multiple paths.
Critical Path
The longest path through the project network. "Longest" means longest duration, not most tasks. A path with 3 tasks taking 30 days total is longer than a path with 10 tasks taking 20 days.
Float (Slack)
The amount of time a task can be delayed without affecting the project end date.
- Total float: How much a task can slip without delaying the project.
- Free float: How much a task can slip without delaying its successor.
- Critical path tasks have zero total float; they cannot slip at all.
Forward Pass
Calculating the earliest possible start and finish dates for each task, moving from the project start to the end.
Backward Pass
Calculating the latest possible start and finish dates for each task (without delaying the project), moving from the project end back to the start.
How to Calculate the Critical Path
Step 1: List All Tasks and Dependencies
Create a table of every task with its duration and predecessors:
| Task | Duration (days) | Predecessors |
|---|---|---|
| A – Requirements gathering | 5 | – |
| B – Database design | 4 | A |
| C – UI wireframes | 3 | A |
| D – API development | 8 | B |
| E – Frontend development | 6 | C |
| F – Integration testing | 4 | D, E |
| G – User acceptance testing | 3 | F |
| H – Deployment | 2 | G |
Step 2: Draw the Network Diagram
Two parallel paths fan out from Task A and rejoin at Task F. The visual makes float obvious. Task C and Task E sit on the shorter path, so they have slack:
Step 3: Forward Pass (Earliest Dates)
Starting from the beginning, calculate the Earliest Start (ES) and Earliest Finish (EF) for each task:
- ES = Latest EF of all predecessors (or 0 for the first task)
- EF = ES + Duration
| Task | Duration | ES | EF |
|---|---|---|---|
| A | 5 | 0 | 5 |
| B | 4 | 5 | 9 |
| C | 3 | 5 | 8 |
| D | 8 | 9 | 17 |
| E | 6 | 8 | 14 |
| F | 4 | 17 | 21 |
| G | 3 | 21 | 24 |
| H | 2 | 24 | 26 |
Note: Task F has two predecessors (D and E). Its ES is the latest EF among them: max(17, 14) = 17.
Project duration = 26 days (the EF of the last task).
Step 4: Backward Pass (Latest Dates)
Starting from the end, calculate the Latest Start (LS) and Latest Finish (LF) for each task:
- LF = Earliest LS of all successors (or project duration for the last task)
- LS = LF − Duration
| Task | Duration | LS | LF |
|---|---|---|---|
| H | 2 | 24 | 26 |
| G | 3 | 21 | 24 |
| F | 4 | 17 | 21 |
| E | 6 | 11 | 17 |
| D | 8 | 9 | 17 |
| C | 3 | 8 | 11 |
| B | 4 | 5 | 9 |
| A | 5 | 0 | 5 |
Step 5: Calculate Float
Total Float = LS − ES (or equivalently, LF − EF)
| Task | ES | EF | LS | LF | Float | Critical? |
|---|---|---|---|---|---|---|
| A | 0 | 5 | 0 | 5 | 0 | Yes |
| B | 5 | 9 | 5 | 9 | 0 | Yes |
| C | 5 | 8 | 8 | 11 | 3 | No |
| D | 9 | 17 | 9 | 17 | 0 | Yes |
| E | 8 | 14 | 11 | 17 | 3 | No |
| F | 17 | 21 | 17 | 21 | 0 | Yes |
| G | 21 | 24 | 21 | 24 | 0 | Yes |
| H | 24 | 26 | 24 | 26 | 0 | Yes |
Step 6: Identify the Critical Path
Tasks with zero float are on the critical path:
A → B → D → F → G → H (26 days)
Tasks C and E have 3 days of float; they can each slip up to 3 days without affecting the project end date.
Using CPM in Practice
Focus Your Attention
In a 50-task project, typically 30-40% of tasks are on the critical path. These are where you should concentrate your daily management attention:
- Check progress daily on critical tasks
- Resolve blockers immediately
- Ensure resources are available when needed
- Escalate risks early
Non-critical tasks still matter, but they have buffer. You can address issues there before they consume all their float.
Crash the Schedule
When you need to shorten the project timeline, CPM tells you where to look. "Crashing" means adding resources to reduce the duration of critical path tasks.
Only crash critical path tasks. Shortening a non-critical task doesn't change the project end date.
Example: If you add a second developer to Task D (API development), reducing it from 8 days to 5 days, the critical path shortens from 26 to 23 days. But if you add resources to Task E (frontend development), the project is still 26 days because D→F is still the longer path.
Fast-Tracking
Another way to shorten the schedule: overlap tasks that were previously sequential. Instead of FS (finish-to-start), change the relationship to SS (start-to-start) with a lag.
Example: Start integration testing (F) when API development (D) is 75% complete instead of 100% complete. This overlaps the tasks, shortening the critical path.
Risk: Fast-tracking increases the chance of rework. If the API changes during that last 25%, testing work may need to be redone.
Monitor Float Erosion
Float isn't static; it changes as the project progresses. A task that started with 5 days of float might have 0 after its predecessor slipped by 5 days. It's now on the critical path.
Track float trends over time. If non-critical tasks are steadily losing float, you may have a scheduling problem developing before any task is actually late.
CPM with Multiple Dependency Types
The example above used only Finish-to-Start (FS) dependencies. Real projects often need others:
Start-to-Start (SS)
Task B starts when Task A starts (or with a lag).
Impact on CPM: Task B's ES = Task A's ES + lag. Both tasks run in parallel, but B can't start first.
Finish-to-Finish (FF)
Task B finishes when Task A finishes (or with a lag).
Impact on CPM: Task B's EF = Task A's EF + lag. Both must complete around the same time.
Start-to-Finish (SF)
Task B finishes when Task A starts.
Impact on CPM: Rarely used. Mainly for just-in-time scheduling (e.g., old shift ends when new shift starts).
Modern PM tools handle all four types automatically in their critical path calculations. If your tool only supports FS, you may be modeling your schedule inaccurately.
Common CPM Mistakes
1. Ignoring Resource Constraints
CPM assumes unlimited resources. In reality, one person can't work on three parallel tasks simultaneously. Resource-constrained scheduling (resource leveling) may lengthen the critical path beyond what pure CPM calculates.
2. Not Updating the Schedule
CPM is only useful with current data. If task progress and actual dates aren't updated regularly, the critical path calculation is based on fiction.
3. Treating All Paths as Equal
Non-critical paths with very little float (1-2 days) are "near-critical"; they can easily become critical if anything slips. Monitor these almost as closely as the critical path itself.
4. Padding Task Durations
If every task estimate includes hidden buffer, the critical path shows an inflated duration and float calculations become meaningless. Use realistic estimates and add explicit schedule buffer (management reserve) instead.
5. Using a Tool That Doesn't Show It
If your PM tool doesn't highlight the critical path, you're managing your schedule blind. This is a non-negotiable feature for any serious project.
For a quick practical audit of the specific critical-path problems that show up in real schedules, see the 7 hidden killers in your MS Project schedule. The free Schedule Health Check runs those checks against your own .mpp and flags the tasks that are silently extending, or hiding, your critical path.
CPM and AI
AI is adding a new dimension to critical path management:
- Predictive float analysis: AI can predict which tasks are likely to consume their float based on historical patterns, flagging at-risk paths before they become critical.
- Duration estimation: AI analyzes past project data to suggest more accurate task durations, improving the reliability of CPM calculations.
- Scenario modeling, "What happens to the critical path if Task D takes 10 days instead of 8?" AI can rapidly model these scenarios.
- Resource-aware critical path: AI factors in resource constraints when calculating the critical path, giving a more realistic picture than pure CPM.
Onplana's AI-powered risk detection continuously monitors the critical path and alerts you when tasks are trending toward delay, often before the PM would notice in a manual review. See our AI in project management guide for the full picture.
Getting Started
- Map your current project's dependencies: Even if you've been managing without CPM, the dependencies exist. Document them.
- Use a tool that calculates it: Don't try to calculate CPM by hand for real projects. Use a Gantt chart tool that highlights the critical path automatically.
- Review weekly: Check the critical path in every status meeting. It should be the first thing you look at.
- Track float trends: Watch non-critical tasks losing float. They're tomorrow's critical path.
Audit your schedule's critical path in 30 seconds Upload an
.mppor MSPDI XML to the free Schedule Health Check and get a per-finding breakdown: dangling tasks, broken dependencies, constraint conflicts, and the real critical path computed from the dependency graph. No signup, no credit card. → Run the Schedule Health Check
Onplana automatically calculates and highlights the critical path in its Gantt chart, with AI-powered monitoring that alerts you to schedule risks. Try it free →
Related reading: What Is a Gantt Chart? · Project Risk Management Guide · Work Breakdown Structure Guide · 7 Hidden Killers in Your MS Project Schedule
Microsoft Project Online™ is a trademark of Microsoft Corporation. Onplana is not affiliated with Microsoft.
Ready to make the switch?
Start your free Onplana account and import your existing projects in minutes.