
Build a CFO-Proof Business Case for Your Project Online Migration
The three-pillar framework for defending a Project Online migration in a CFO review, cost of inaction, 3-year TCO delta, risk-adjusted ROI. Templates included.
You know you need to migrate. The PMO knows. The directors of the affected business units know. The September 30, 2026 retirement date isn't moving, the calendar is unforgiving, and it's the last of three Microsoft retirements compressed into the same six-month window.
What you don't have is sign-off on the spend.
Most Project Online migration business cases die in the CFO review. Not because the CFO disagrees that something needs to happen, but because the case the PMO brings to the meeting is built around the wrong question. This post is the playbook for the right question, the three-pillar framework that consistently gets these projects approved on the first review instead of going back for revision two or three times before the deadline gets uncomfortable.
For the CFO's licensing question: the side-by-side Microsoft Project SKU matrix is the eight-tier reference behind any license-delta calculation.
The CFO-proof framework, in 30 seconds
- Pillar 1, Cost of inaction: what does October 1, 2026 cost if you don't migrate? This anchors the case.
- Pillar 2, 3-year TCO delta: total cost of new tool vs. equivalent cost of staying on Project Online (workarounds + emergency consulting). Year-by-year.
- Pillar 3, Risk-adjusted ROI: low/mid/high scenarios with explicit assumptions. Show the range, not a single number.
- Lead with hard numbers. Soft benefits ("better collaboration") go in the appendix, not the opening slide.
- Use the Migration Cost Calculator at /tools/migration-cost-calculator to model both scenarios with consistent assumptions.
Why most Project Online business cases get rejected
A typical PMO walks into the CFO review with this slide deck:
- Problem: Project Online is retiring in September 2026
- Proposal: Migrate to [Tool X], which has features A, B, and C
- Cost: Migration $80K + 3-year licenses $150K = $230K
- Benefits: Better collaboration, modern UX, AI features
- Ask: Approve $230K spend
The CFO has three problems with this case before the slides finish loading:
Problem 1: The cost of not doing this is missing. Without a credible number for what staying on Project Online costs, $230K looks like an optional spend instead of a risk-mitigation spend. Optional spends get deferred to next quarter; risk-mitigation spends get approved.
Problem 2: "Better collaboration" is uncountable. CFOs have been burned by every business case that opened with "improved productivity" benefits that never showed up in the P&L. They discount soft benefits to roughly zero unless there's a hard number underneath them.
Problem 3: There's no range. A single $230K number with no scenarios looks like the PMO got the answer they wanted from one quote and stopped looking. CFOs trust ranges with explicit assumptions; they don't trust point estimates.
Now look at the same case rebuilt with the three-pillar framework.
Pillar 1: Cost of Inaction
This is the slide the PMO usually skips and the CFO always asks for. The question it answers: "What does it cost us if we do nothing?"
The default answer ("nothing, we'll just migrate later") is wrong on three counts:
Component 1: Emergency-rate consulting
Project Online migration partners book up. By Q2 2026 the calendar starts filling; by Q3 the rates spike because demand outstrips supply. A migration that costs $80K with a 12-week runway in April becomes $130-180K with a 4-week runway in August. We've seen this play out in every Microsoft retirement cycle: Skype for Business in 2021, classic SharePoint workflows in 2024, and Project Online will be no different.
Number to use in your slide: take your migration partner's quoted price and apply a 1.5–2× multiplier for migrations starting after July 2026. Ask the partner directly what their late-stage rate is; they'll tell you because they want the early booking.
Component 2: Manual workarounds
After September 30, the schedules don't disappear, but the interface to them does. PWA stops loading. OData stops responding. The Project Desktop client's online features fail. The PMO doesn't stop running; it just becomes a manual operation supported by Excel exports, SharePoint document libraries, and increasingly elaborate workarounds.
The cost is FTE time. A typical PMO discovers the workarounds consume 15–25% of every PM's week. For a 10-PM organization at $120K/PM loaded cost, that's:
- 10 PMs × $120K × 20% = $240K/year in productivity loss
This number is conservative. It assumes the workarounds work. They usually don't, and the actual cost climbs as the gap stretches.
Component 3: Reporting outage during the gap
Most PMOs feed Power BI / Excel reporting from the Project Online OData endpoint. When the endpoint stops responding, every dashboard built on it goes dark. The org's leadership stops getting weekly portfolio rollups. Strategic decisions made during the outage are made without the data they used to depend on.
This is the hardest cost to quantify because it depends on what decisions get made wrong. But CFOs understand the principle, and a sentence like "the executive portfolio dashboard goes dark for the migration window" is usually enough to land the point.
Putting Pillar 1 together
A typical mid-sized PMO (50 PMs, 200 active projects) will see Pillar 1 land somewhere between $400K and $800K of one-time and ongoing cost if the migration is delayed past Q2 2026. The exact number is less important than presenting it as the floor of the conversation. Once the CFO has a credible cost-of-inaction number, the migration spend stops looking optional.
Pillar 2: The 3-Year TCO Delta
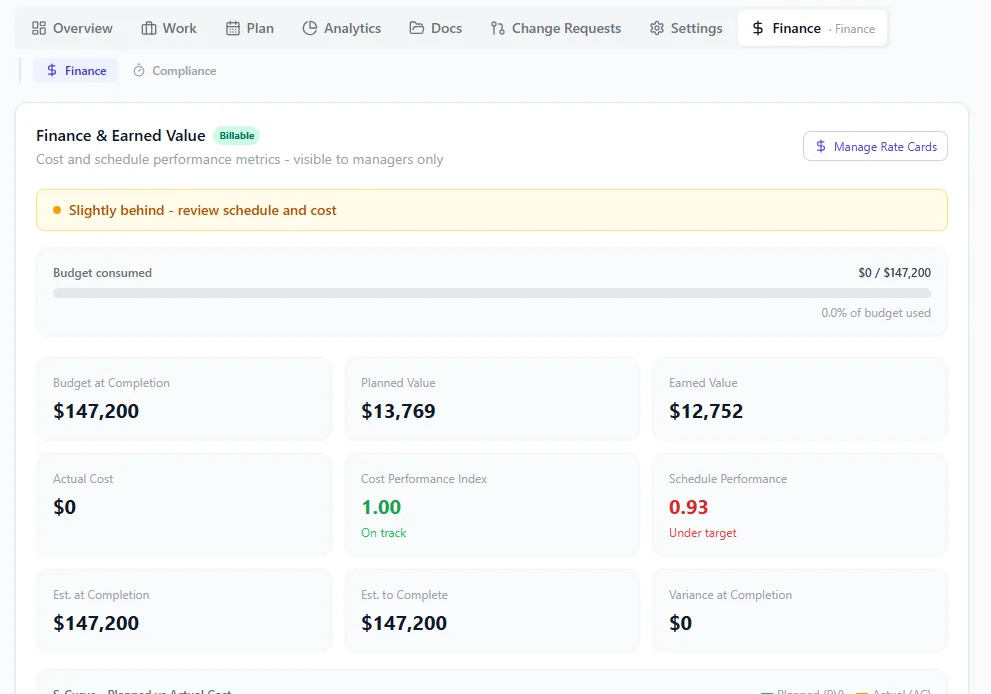
Project finance with EVM built in: planned value, earned value, and actual cost curves charted on one panel, CPI and SPI surfaced as tiles, and the forecast-at-completion number the CFO actually asks for shown without a spreadsheet. The TCO conversation is harder when this view is missing.
This is where most business cases live. The mistake most PMOs make is presenting only the new cost, what the migration and the new platform will cost over three years.
What the CFO actually needs is the delta between two scenarios:
Scenario A: Migrate now
- Year 1: migration cost + new license cost
- Year 2: new license cost only
- Year 3: new license cost only
Scenario B: Do nothing (or delay)
- Year 1: emergency consulting + workarounds + reporting outage cost (Pillar 1 numbers)
- Year 2 and 3: ongoing workaround cost + eventual delayed migration cost at premium rates
Run both scenarios through the same set of assumptions: same number of users, same project count, same productivity assumptions. Use the Migration Cost Calculator; it produces the year-by-year breakdown CFOs expect, with the assumptions visible so finance can sanity-check them.
The output is a single chart: cumulative cost of each scenario over 36 months. Scenario A spikes in year 1 then flattens. Scenario B starts lower but grows steadily. The crossover point is usually month 14–18; that's when migrating now starts paying for itself.
For the deeper cost analysis, the cost of migrating from MS Project Online post breaks down the actual line items by tier and PMO size. The full pre-migration inventory at /blog/project-online-migration-checklist-2026 maps to your specific scope drivers.
Pillar 3: Risk-Adjusted ROI
Single-number business cases die in CFO reviews because the CFO can't tell which assumptions drive the number. The fix is to present three scenarios, low, mid, and high, each with the assumptions that produce it.
The low case (best outcome)
- Migration goes smoothly with the current partner quote
- Productivity returns to baseline within 30 days of cutover
- No scope expansion during migration
- Net 3-year cost: e.g. $180K, payback in 16 months
The mid case (likely outcome)
- 15% over the partner quote (the typical overrun)
- 60-day productivity dip during transition
- Two minor scope additions (custom reports, an integration)
- Net 3-year cost: e.g. $260K, payback in 22 months
The high case (worst credible outcome)
- 30% over the partner quote
- 90-day productivity dip
- One scope expansion that adds 4 weeks
- Net 3-year cost: e.g. $360K, payback in 30 months
The Migration Cost Calculator outputs exactly this format, three scenarios with sensitivity analysis showing which inputs move the answer most. CFOs love this format because it answers their next question before they ask it: "What if it costs more than you think?" In the high case, it costs $360K, payback is 30 months, and the case still works.
Putting the slide deck together
The CFO-proof deck has six slides:
- Setup: Project Online is retiring on September 30, 2026 (one slide, one fact, one date)
- Pillar 1: Cost of inaction: $X total, broken into three components
- Pillar 2: TCO delta: stacked bar chart, 36 months, both scenarios on the same axes
- Pillar 3: Three scenarios: low / mid / high with the assumption that distinguishes each
- Recommendation: Migrate now, $Y mid-case spend, $Z low-case if execution goes well
- Appendix: Soft benefits, vendor shortlist, references from comparable PMOs
Notice what's not in the first five slides: feature lists. CFOs don't approve feature lists; they approve risk-adjusted financial decisions. The features go in the appendix because the question they answer ("which tool?") gets resolved after the question of whether to migrate at all. The PMO and CIO own that question; the CFO trusts you on it once the financial case lands.
For the actual feature comparison work, the alternatives roundup and the head-to-head comparison are the appendix material. Don't lead with them.
What changes if your PMO is small
The framework scales down cleanly. For a 10-PM organization running 50 projects:
- Pillar 1 cost-of-inaction is in the $50–120K range
- Pillar 2 3-year delta is in the $30–80K range
- Pillar 3 scenarios cluster tighter (less optionality)
The deck stays six slides. The numbers get smaller. The structure is the same.
The trap small-PMO migrations fall into is under-presenting, assuming the spend is small enough that the CFO won't look closely. CFOs scrutinise small spends too, and a small business case with no risk analysis still gets rejected. Run the same three pillars regardless of scale.
What if the CFO still says no
If the case lands and the CFO still pushes back, it's almost always one of three reasons:
The cost-of-inaction number isn't credible. They don't believe Project Online will actually retire, or they don't believe the workaround cost will be that high. Cure: pull in the Microsoft retirement notice (MC812729) and a written quote from a migration partner with their late-stage rates.
The TCO delta is too tight. Payback is in year 3 and the CFO would rather defer to next year's budget. Cure: re-run Pillar 1 to make the cost-of-delay more visible. Often this is where you find the deferred-migration number actually exceeds the migration spend.
The mid-case scenario is too optimistic. They don't trust the 15% overrun assumption. Cure: present the high case as the planning number. Approval gets harder, but a high-case approval that delivers under-budget is a far better outcome than a mid-case approval that overruns.
The 90-day path forward
If you have CFO sign-off, the migration playbook is the operational layer underneath this business case. Twelve weeks, six steps, parallel operation during validation.
If you don't have sign-off yet, calculate your migration cost on your specific situation and use the output to populate the three pillars above. The deck writes itself once the numbers are clean.
The September 30, 2026 deadline isn't moving. Every month of delay raises Pillar 1 and tightens the migration window. The case that wins in the CFO review today is the one that treats the migration as risk mitigation forced by a vendor end-of-life, not as a tool replacement project the PMO would like to do.
Onplana's Migration Cost Calculator produces the exact format CFOs expect, 3-year TCO comparison, low/mid/high scenarios, sensitivity analysis, and a downloadable PDF you can drop straight into your business case deck. No account needed.
Related reading: Cost of Migrating from MS Project Online · Project Online Migration Checklist · How to Migrate from Project Online · PMO Maturity Tiers Explained
Microsoft Project Online™ is a trademark of Microsoft Corporation. Onplana is not affiliated with Microsoft.
Ready to make the switch?
Start your free Onplana account and import your existing projects in minutes.