Earned Value Management Explained: PV, EV, AC, CPI, and SPI
Earned value management explained from zero: PV, EV, AC, CPI, SPI, EAC, and ETC with a worked example, so a status report stops hiding budget trouble.
A status report says a project is 65 percent complete and on track. Three weeks later, the same project is 20 percent over budget and the finish date has quietly slipped by six weeks. Nobody lied in the status report. The status report just never asked the question that would have caught this: how much did it cost to get to 65 percent, and does that number match what was planned?
That is the gap earned value management closes. Percent complete tells you how much work is done. It says nothing about whether the work cost more than it should have, or whether the pace of completion matches the schedule the project was baselined against. Earned value management (EVM) puts a number on both, using data most PMOs are already collecting and mostly failing to connect.
TL;DR. Earned value management compares three figures in the same currency: Planned Value (what you should have spent by now), Earned Value (what the completed work is actually worth), and Actual Cost (what you really spent). Two ratios follow: CPI (EV / AC) for cost efficiency and SPI (EV / PV) for schedule efficiency. Below 1.0 on either means trouble; above 1.0 means you're ahead. From there, EAC (Estimate at Completion) and ETC (Estimate to Complete) forecast where the project actually finishes if the current trend holds. The formulas are five minutes of arithmetic. The hard part is having accurate PV, EV, and AC numbers to plug in, which is a baseline discipline problem, not a math problem.
What Earned Value Management Actually Measures
Earned value management rests on three inputs, all expressed in the same unit, usually dollars, so they can be compared directly.
Planned Value (PV) is how much work you scheduled to complete by a given date, priced at the budget rate. If a $750,000 project is baselined to be 42 percent complete by the month-5 checkpoint, PV at that checkpoint is $315,000. PV comes entirely from the baseline; it does not change based on what actually happened.
Earned Value (EV) is how much of the approved budget the completed work is worth, regardless of what it cost to get there. If the project is actually 35 percent complete at that same checkpoint, EV is $262,500. EV is a measure of physical progress, priced at planned rates, not a measure of spend.
Actual Cost (AC) is what the project has really spent to reach that 35 percent, and it is independent of both PV and EV. In this example, say the project has spent $301,000.
Three numbers, one checkpoint: PV = $315,000, EV = $262,500, AC = $301,000. Read individually, none of them tells you much. Compared to each other, they tell you exactly where the project stands, which is the entire point of earned value management.
Every Earned Value Term at a Glance
The three inputs and the five figures they produce all follow directly from each other. This table is the reference to come back to once the individual formulas below start blurring together.
| Term | Formula | What it tells you |
|---|---|---|
| PV (Planned Value) | Read from the baseline | What should be done by now, priced at the budget rate |
| EV (Earned Value) | % complete x approved budget | What the completed work is actually worth |
| AC (Actual Cost) | Recorded spend to date | What the project really spent to get there |
| CPI (Cost Performance Index) | EV / AC | Cost efficiency: below 1.0 means over budget per unit of work |
| SPI (Schedule Performance Index) | EV / PV | Schedule efficiency: below 1.0 means behind schedule |
| EAC (Estimate at Completion) | BAC / CPI | Forecast total cost if the current cost trend holds |
| ETC (Estimate to Complete) | EAC minus AC | What's left to spend from today forward |
| VAC (Variance at Completion) | BAC minus EAC | Gap between the approved budget and the forecast final cost |
How to Calculate CPI and SPI
Two ratios turn the three inputs above into a diagnosis. Both are simple division, and both compare against the same threshold: 1.0 is on plan, below 1.0 is behind, above 1.0 is ahead.
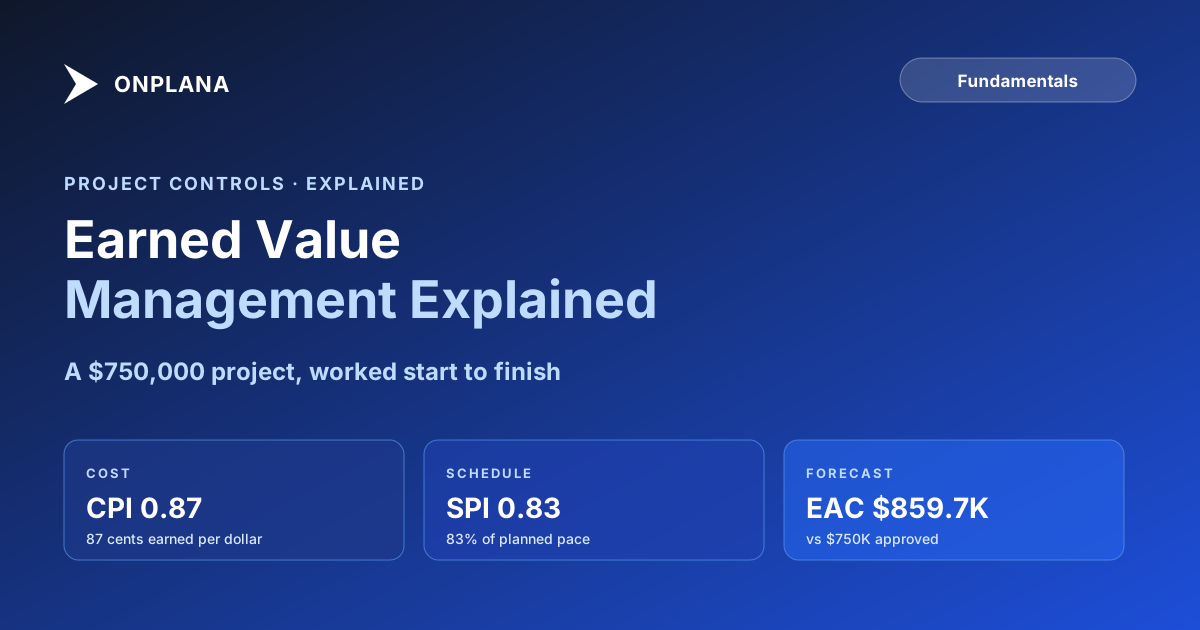
- Calculate the Cost Performance Index. CPI = EV / AC. Using the numbers above: $262,500 / $301,000 = 0.87. The project is earning 87 cents of planned value for every dollar it actually spends.
- Calculate the Schedule Performance Index. SPI = EV / PV. Using the same numbers: $262,500 / $315,000 = 0.83. The project has completed 83 percent of the work it should have completed by this point in the schedule.
- Read both ratios together, not separately. A CPI of 0.87 and an SPI of 0.83 describe a project that is simultaneously over budget for the work delivered and behind the schedule for the time elapsed. Neither number alone tells the full story; a project can post a healthy CPI while its SPI signals a schedule that is quietly slipping, or the reverse.
- Compare against the trend, not just the snapshot. A single checkpoint's CPI of 0.87 could be a one-time cost spike (a piece of equipment failed and was replaced) or a structural problem (the estimate was wrong from day one). Plot CPI and SPI at every reporting period; a ratio that is stable but below 1.0 is a different problem than one that is falling every month.
What a CPI of 0.87 and an SPI of 0.83 Actually Mean
Numbers below 1.0 are not automatically a crisis, but they are a signal that deserves a specific interpretation rather than a general "we're a bit behind."
A CPI of 0.87 means that if the current cost trend holds for the rest of the project, the final cost will land around 15 percent over the approved budget. That is not a guess; it is what the ratio implies mathematically, covered in the forecasting section below. An SPI of 0.83 means the project has done 83 percent of the work the schedule expected by this date, which converts into a real time delay, not just an abstract percentage.
The distinction that trips up most PMs: SPI is not measured in days or weeks. It is a value-based ratio, not a duration-based one. A project with 10 remaining months and an SPI of 0.83 is not automatically "1.7 months behind." The schedule variance needs converting through the remaining planned burn rate to translate into a calendar impact, which is one of the reasons EVM works better paired with critical path analysis than as a replacement for it. EVM tells you the project is losing time in aggregate; critical path analysis tells you which specific tasks are causing the loss. It also means SPI needs reading against its own known blind spots, and earned schedule exists specifically to restate this value-based ratio back into real time units.
Forecasting the Finish: EAC, ETC, and VAC
The forecasting formulas are where EVM earns its keep, because they convert a snapshot ratio into an answer to the question every sponsor actually asks: what will this cost when it's done?
Budget at Completion (BAC) is the total approved budget, $750,000 in the running example. It does not change during execution; it is the baseline against which everything else is measured.
Estimate at Completion (EAC) forecasts total project cost given performance so far. The most common formula assumes the current cost trend continues for the remaining work:
EAC = BAC / CPI = $750,000 / 0.87 ≈ $859,700
Estimate to Complete (ETC) is what remains to be spent from today forward:
ETC = EAC − AC = $859,700 − $301,000 = $558,700
Variance at Completion (VAC) is the gap between what was approved and what the project is now forecast to actually cost:
VAC = BAC − EAC = $750,000 − $859,700 = −$109,700
A negative VAC means the project is tracking to finish roughly $110,000 over its original budget if nothing changes. That is a materially different conversation with a sponsor than "we're a little behind," because it comes with a specific number and a specific formula behind it, not a hedge.
Two caveats matter here. First, EAC = BAC/CPI assumes the cost trend so far predicts the cost trend ahead, which is a reasonable default but not always true; a one-time cost spike (a vendor invoice dispute, a hardware failure) that will not recur should not be projected forward at the same rate. Second, EAC formulas that also weight SPI exist for projects where schedule risk is expected to compound cost risk, but BAC/CPI is the version most PMOs should start with; it is auditable and easy to defend in a review.
The diagram above is the classic EVM S-curve: cumulative planned, earned, and actual value plotted against time. When the red line (actual cost) sits above the green line (earned value), the project is spending more than the work is worth. When the green line sits below the blue line (planned value), the project is behind schedule. Reading the relative position of all three lines at a glance is faster than reading a table of ratios, which is why EVM dashboards lead with the S-curve and use CPI and SPI as the supporting numbers.
Why Is EVM the Least-Applied Framework in Project Management?
EVM has been a formal requirement on US Department of Defense contracts since the 1960s, and the standard EVM formula set used across defense acquisition programs is the same PV/EV/AC/CPI/SPI/EAC/VAC set covered above. It is one of the most cited techniques in project management certification curricula, yet most commercial PMOs outside government contracting never run it consistently. Three reasons show up repeatedly.
The first is data discipline. EVM requires actual cost captured at the same task-level granularity as the schedule, which means timesheet and invoice data has to map cleanly onto the WBS. Most organizations track cost at the department or vendor level, not the task level, and retrofitting that mapping onto an existing project is real work. Part of that discipline is picking the right level to measure at in the first place: every formal EVM standard anchors PV, EV, and AC at the control account, the layer that groups related work packages under one accountable manager, rather than at the individual task.
The second is baseline maintenance. PV only means something if the baseline it is compared against is realistic and has not silently drifted. A schedule that gets re-baselined informally every time it slips produces a PV line that always matches reality, which makes CPI and SPI meaningless; they will always read close to 1.0 because the yardstick keeps moving to match the tape.
The third is organizational appetite for the bad news EVM produces early. A project reporting "70 percent done" feels fine in a status meeting. The same project reporting a CPI of 0.85 in month three is a harder conversation to have, even though it's a more honest one, and it's exactly the kind of conversation EVM is built to force before the number gets worse.
EVM Needs a Real Baseline, or It's Fiction
Every formula in this post assumes PV comes from an approved, unmolested baseline. If the baseline itself is broken, every downstream number, CPI, SPI, EAC, VAC, inherits that error and reports it back with false precision.
The most common way a baseline goes bad before EVM ever runs on it: schedules with dangling dependencies, missing predecessors, or constraint conflicts that were never resolved before the plan was frozen. A baseline built on a schedule like that produces a PV curve that looks smooth on a chart and is arithmetically meaningless, because the underlying task network doesn't actually represent an executable plan. Run the free Schedule Health Check against your .mpp or MSPDI export before you baseline a schedule for EVM reporting; it flags dangling tasks, broken dependencies, and constraint conflicts that would otherwise silently corrupt every PV number calculated against that baseline for the life of the project.
Building an EVM Reporting Cadence That Sponsors Trust
Getting the formulas right is the easy part. Getting a sponsor to trust the numbers enough to act on them takes a specific reporting habit.
- Report CPI and SPI at the same cadence every period. Monthly is standard for most projects; biweekly for high-velocity or high-risk ones. Changing the cadence to hide a bad month erodes trust immediately.
- Show the trend line, not just the current value. A single CPI of 0.87 could be noise. Three consecutive periods of declining CPI is a pattern a sponsor needs to see, not just be told about.
- Pair every ratio with the driver, not just the number. "CPI is 0.87 because the vendor invoice for phase 2 hardware came in 18 percent over quote" is defensible. "CPI is 0.87" alone invites the sponsor to assume the worst about the team.
- Update EAC every period, and show the delta from the last EAC. A forecast that moves is normal. A forecast that jumps from "on budget" to "20 percent over" with no warning in between means the reporting cadence missed something, not that the project suddenly got worse.
- Tie the forecast to a decision, not just a number. If EAC shows a $110,000 overrun, the report should say what the options are: absorb it, cut scope, or request additional budget now while there's still runway to act on it.
The gap between a PMO that runs EVM well and one that doesn't is rarely the math. It's whether the organization has the baseline discipline to make PV mean something and the reporting discipline to surface a bad CPI in month three instead of month nine, when the only options left are expensive ones.
Microsoft Project Online™ is a trademark of Microsoft Corporation. Onplana is not affiliated with Microsoft.
Frequently asked questions
What is earned value management in simple terms?
Earned value management (EVM) compares three numbers, the work you planned to complete, the work you actually completed, and what you spent to complete it, all expressed in the same currency. The comparison produces two ratios, CPI for cost efficiency and SPI for schedule efficiency, that tell you whether a project is truly on track or only looks that way.
What is the difference between CPI and SPI?
CPI (Cost Performance Index) measures how efficiently the project is spending money: EV divided by AC. SPI (Schedule Performance Index) measures how efficiently the project is using time: EV divided by PV. A project can have a healthy CPI and a poor SPI at the same time, or the reverse.
What does a CPI of 0.87 mean?
It means the project is earning 87 cents of planned value for every dollar actually spent. Below 1.0 is over budget per unit of work completed; above 1.0 is under budget. A CPI of 0.87 held for the rest of the project means the final cost will land roughly 15 percent over the original budget.
How do you calculate Estimate at Completion (EAC)?
The most common formula is EAC = BAC / CPI, where BAC is the total approved budget and CPI is the current cost performance index. It assumes the cost trend observed so far continues for the remaining work. Other EAC formulas adjust for schedule risk or a one-time cost overrun that will not repeat.
Can a project have good earned value numbers and still fail?
Yes, if the baseline itself is wrong. EVM measures performance against the approved plan, not against reality. A padded schedule or an unrealistic budget will produce a flattering CPI and SPI right up until the plan collides with what the work actually requires.
Do you need special software to run earned value management?
No. EVM only needs three inputs tracked consistently: planned value by period, earned value by period, and actual cost by period. A spreadsheet works for a single project. Most PMOs move to a PM tool once they are tracking EVM across a portfolio, because rolling up CPI and SPI by hand across a dozen projects does not scale.
Ready to make the switch?
Start your free Onplana account and import your existing projects in minutes.