Monte Carlo Schedule Simulation: Confidence, Not One Date
Monte Carlo project schedule simulation replaces a single finish date with a probability curve. How it works, the P50 and P80 dates, and reading the tail.
Ask a PM for the project finish date and you get one date. Ask what "on track" means and you get a shrug, because the single date was never really a prediction, it was the deterministic critical path calculation, run once, with each task's most likely duration plugged in as if it were certain. A Monte Carlo project schedule simulation exists precisely because every task in that calculation could run exactly as planned and the project would hit that date, and the odds of every task running exactly as planned are close to zero.
The right question a single date can't answer is: given everything we actually know about how uncertain each task is, what's the real distribution of possible finish dates, and how confident should we be in any one of them?
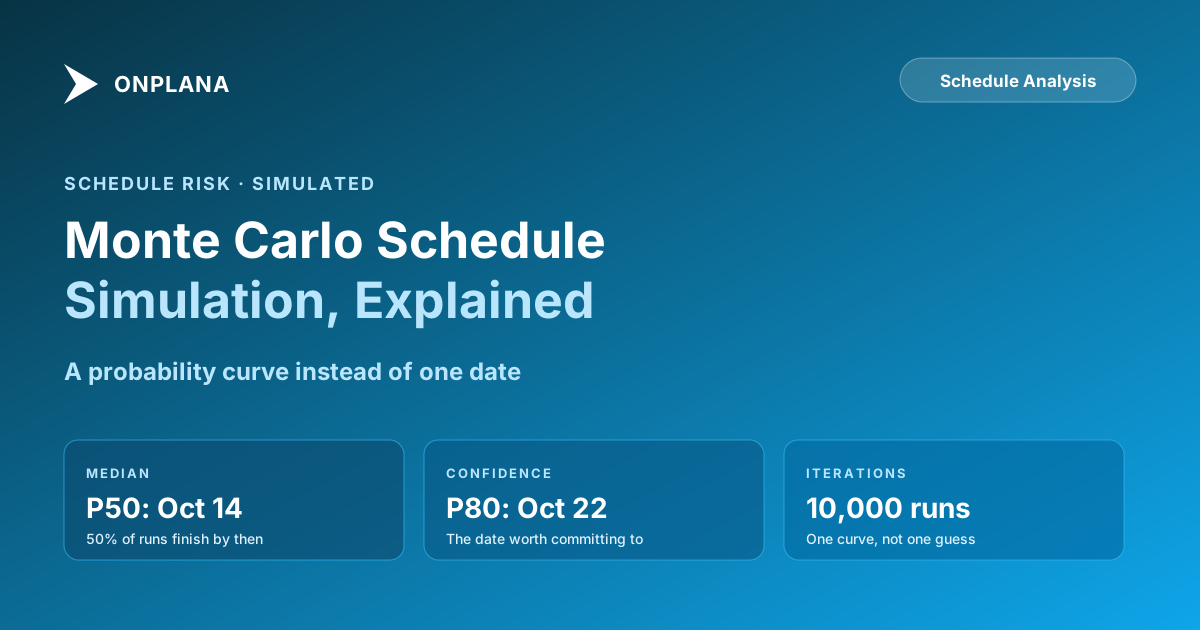
TL;DR. Monte Carlo schedule simulation runs the project network thousands of times, sampling a random duration from each task's probability distribution on every run instead of using one fixed number. The output is a cumulative probability curve: a P50 date (50 percent of runs finished by then) and a P80 date (80 percent finished by then) instead of one deterministic date. The gap between P50 and P80 tells you how much real uncertainty the schedule is carrying. A criticality index, the percentage of runs where each task landed on the critical path, often points at a different set of risk drivers than the deterministic critical path does.
What Monte Carlo Simulation Actually Does to a Schedule
Monte Carlo methods are a broad class of computational techniques that use repeated random sampling to model outcomes for problems with significant uncertainty, originally developed for physics and applied to scheduling decades later. A deterministic schedule takes one duration per task, usually the estimator's most likely guess, and calculates exactly one critical path and exactly one finish date. It's the schedule you get from a standard forward pass and backward pass through the network, the same critical path method calculation every scheduling tool runs by default.
Monte Carlo simulation takes the same network of tasks and dependencies but replaces each task's single duration with a probability distribution, typically the optimistic, most likely, and pessimistic three-point estimate covered in PERT estimation. The simulation then runs the entire schedule end to end thousands of times. On each run, every task's duration is randomly sampled from its distribution, the network is recalculated, and a finish date comes out. After a few thousand runs, instead of one date, you have a distribution: a histogram of every finish date the simulation actually produced, weighted by how often each one occurred.
That distribution is the honest answer to "when will this finish." A single deterministic date is one point sampled from that distribution, usually somewhere near the middle, and it carries none of the information about how wide or narrow the real range is.
The Inputs Monte Carlo Needs, and the Ones People Get Wrong
Monte Carlo simulation is only as good as three inputs, and all three are places where a rushed setup quietly produces a confident-looking, wrong result.
A duration distribution for every task that matters. Tasks with real uncertainty need a three-point estimate, not a single number treated as both the mean and the range. A task where optimistic, most likely, and pessimistic are all set to the same value contributes zero variance to the simulation, whether or not that reflects reality.
The complete, correct dependency network. Monte Carlo doesn't fix a broken schedule, it runs the schedule you give it, over and over. Dangling tasks, missing predecessors, and unintended constraint dates all propagate through every single iteration. A schedule audit before simulation, not after, is the only way to know the ten thousand runs are ten thousand runs of the right network. The free Schedule Health Check flags dangling tasks, missing dependencies, and constraint conflicts in a .mpp or MSPDI file before you sink time into a simulation built on top of them.
Resource constraints, if they matter. Pure Monte Carlo schedule simulation, like pure CPM, generally assumes unlimited resources unless the simulation tool explicitly models resource leveling. If two tasks that can only be done by the same specialist land in parallel in a given iteration, the simulation may show a finish date that's impossible in practice because that person can't work both tasks at once. Resource-aware simulation exists but is materially more complex to set up correctly; most PMOs start with the unconstrained version and treat known resource bottlenecks as a manual caveat on the output.
How the Simulation Actually Runs
- Assign a duration distribution to every task with real uncertainty. Use three-point estimates where the team has enough context to give an honest optimistic and pessimistic case; use a fixed duration only for tasks that genuinely don't vary (a mandatory approval wait time set by policy, for example).
- Confirm the dependency network is complete and correct. Every task should have real predecessors and successors; no task should be floating disconnected from the network by accident.
- Set the iteration count. A few thousand iterations is standard. Fewer than a few hundred produces a jagged, unreliable curve; tens of thousands beyond the point of stabilization mostly costs compute time without changing the answer.
- Run the simulation. Each iteration samples one random duration per task from its distribution, recalculates the network forward and backward, and records that run's finish date and which tasks sat on that run's critical path.
- Aggregate the results into a cumulative probability curve. Sort all the recorded finish dates and plot the percentage of runs completed by each date, which is the S-curve covered next.
- Read the criticality index alongside the curve. For each task, compute the percentage of iterations in which it appeared on that run's critical path. This is where the real risk drivers often differ from the deterministic critical path.
Reading the S-Curve: What Do P50 and P80 Actually Mean?
The curve above is the standard output of a schedule Monte Carlo simulation: cumulative probability on the vertical axis, possible finish dates on the horizontal axis. Reading it left to right, the curve answers "what percentage of simulated runs finished by this date."
The deterministic CPM date is usually optimistic. In the example above, October 9, the date the standard critical path calculation produces, only had about a 25 percent chance of actually holding across the simulated runs. That's not a flaw in CPM; it's simply what happens when every task's most likely duration is treated as guaranteed. Roughly three out of four simulated outcomes finished later than the single number in the status report.
P50 is the median, not a safe bet. October 14 in the example means half of all simulated runs finished by that date and half finished later. Committing publicly to a P50 date means you have roughly even odds of missing it, which is a coin flip most sponsors don't realize they're being offered when a PM reports "the schedule says October 14."
P80 is the number worth committing to externally. October 22 reflects an 80 percent chance of finishing on time, which is the confidence level most PMOs use for dates that go outside the team, client commitments, regulatory deadlines, contractual milestones. The 12-day-plus gap between the deterministic date and P80 in this example is the real schedule risk the status report was hiding.
The steepness of the curve tells you about volatility, not just the dates. A steep S-curve rising quickly from 20 percent to 80 percent means the outcomes cluster tightly; the project is fairly predictable. A shallow, drawn-out curve means wide variance; small changes in a few key tasks swing the finish date a lot, and the team should treat even the P80 date with more caution.
Which Tasks Drive the Tail? Criticality Index Explained
The S-curve tells you when the project might finish. The criticality index tells you why. For each task, the criticality index is the percentage of simulated iterations in which that task appeared on the critical path for that specific run.
A task with 3 days of float in the deterministic schedule looks safe by conventional critical path analysis; float means the task can slip without affecting the finish date. But if that task's duration is highly uncertain, a wide optimistic-to-pessimistic spread, it might land on the critical path in 60 percent of simulated runs, because in most of the sampled scenarios its pessimistic tail is long enough to eat through the float and beyond. That task deserves closer monitoring than its deterministic float suggests. Conversely, a task with zero float in the deterministic schedule but very tight, well-understood duration variance might have a criticality index well under 100 percent, because in most sampled scenarios other paths end up longer.
This is the single biggest reason Monte Carlo simulation earns its cost over pure CPM for schedules with meaningful uncertainty: it can surface that the real risk driver isn't the path CPM labeled "critical," it's a nearby path carrying more duration variance that becomes critical often enough to matter.
When Is Monte Carlo Worth the Effort?
Monte Carlo simulation is real setup work: getting honest three-point estimates from estimators, verifying the dependency network is complete, and interpreting a probability curve instead of a single date for an audience that usually wants one number. It's worth that cost when the stakes and the uncertainty are both real.
Worth it: Schedules with genuine duration uncertainty (R&D, novel technical work, first-time vendor integrations), external commitments where missing a date has real contractual or reputational cost, and portfolios where a PMO needs a defensible confidence level to report upward, not just a date.
Not worth it, at least not at full rigor: Small, routine projects with well-understood task durations, internal work with no hard external deadline, or any schedule where the underlying dependency network hasn't been audited yet, because simulating a broken network just produces a confident-looking wrong answer faster.
Monte Carlo vs a Single Critical Path Date
| Dimension | Deterministic critical path | Monte Carlo simulation |
|---|---|---|
| Output | One finish date | A probability curve across many possible dates |
| Task duration input | One number per task | A distribution per task (optimistic, most likely, pessimistic) |
| Confidence level | Implicit, and usually low | Explicit (P50, P80, P90) |
| Identifies risk drivers | Yes, the deterministic critical path | Yes, plus a criticality index for near-critical paths |
| Setup effort | Low, standard scheduling practice | Higher, needs distributions and iteration tooling |
| Best for | Fast internal check, well-understood work | External commitments, novel or uncertain work |
| Common failure mode | Mistaking the single date for a guarantee | Running it on an unaudited, broken schedule |
| Communicates well to sponsors | Yes, but overstates certainty | Yes, if translated into a recommended date plus range |
Neither replaces the other. The deterministic critical path is still the fastest way to know which tasks matter for the finish date on any given day, and it's the calculation that runs constantly, every schedule update. Monte Carlo simulation is a periodic exercise, run at key planning gates, that answers a question the deterministic calculation structurally can't: how confident should we actually be.
Common Mistakes That Make Monte Carlo Outputs Useless
Running the simulation on a schedule with dangling dependencies or missing predecessors. The simulation faithfully recalculates a broken network ten thousand times and produces a smooth, professional-looking curve for a schedule that was never executable in the first place.
Using the same three-point estimate for every task regardless of actual uncertainty. If every task gets an arbitrary 20 percent optimistic-pessimistic spread instead of estimator judgment, the simulation output reflects that arbitrary assumption, not real schedule risk.
Reporting P50 as if it were a safe commitment. P50 is a coin flip by definition. Treating it as "the schedule" instead of "the median of the schedule" sets up the same false confidence Monte Carlo was supposed to fix.
Ignoring the criticality index and only reading the S-curve. The curve tells you when; the criticality index tells you where the risk actually concentrates. Skipping it means you know the project might run late without knowing which tasks to watch.
Treating one simulation run as permanent. A simulation reflects the estimates and the network at the moment it ran. Re-run it at each major planning gate, using updated three-point estimates as tasks complete and uncertainty resolves; a schedule risk profile from three months ago is not the schedule risk profile today.
Audit the schedule before you simulate it Monte Carlo results are only as trustworthy as the dependency network underneath them. Run the free Schedule Health Check first to catch dangling tasks, broken dependencies, and constraint conflicts in your
.mppor MSPDI file, before those errors get baked into ten thousand simulated iterations. → Run the Schedule Health Check
Microsoft Project Online™ is a trademark of Microsoft Corporation. Onplana is not affiliated with Microsoft.
Frequently asked questions
What is Monte Carlo simulation in project management?
Monte Carlo simulation runs a project schedule thousands of times, each run sampling a random duration from every task's probability distribution instead of using one fixed duration. The result is a probability curve for the project finish date rather than a single deterministic date.
What is a P80 date and why do PMOs use it?
P80 is the finish date by which 80 percent of the simulated runs completed. It is more conservative than the P50 (median) date and is commonly used for external commitments, because missing an 80-percent-confidence date is less likely than missing a 50-percent-confidence one.
What inputs does a Monte Carlo schedule simulation need?
Every task needs a duration distribution, usually a three-point estimate (optimistic, most likely, pessimistic) that PERT or Monte Carlo can sample from, plus the full dependency network so the simulation knows which tasks feed which. Missing or wrong dependencies produce a confident-looking curve for the wrong schedule.
What is a criticality index?
The criticality index is the percentage of simulation runs in which a given task landed on the critical path. A task with a low float in the deterministic schedule but a high criticality index (over 50 percent, for example) is a bigger real risk than its float alone suggests.
How many iterations does a Monte Carlo schedule simulation need?
Most schedule simulation tools default to 1,000 to 10,000 iterations. Results generally stabilize by a few thousand iterations for schedules of typical size; running more rarely changes the P50 or P80 date meaningfully, it mostly smooths the tails of the curve.
Is Monte Carlo simulation the same as the critical path method?
No. The critical path method calculates one deterministic path using fixed durations. Monte Carlo simulation runs the same network thousands of times with sampled durations and can reveal that a path other than the deterministic critical path is actually the more frequent driver of project delay.
Ready to make the switch?
Start your free Onplana account and import your existing projects in minutes.