PERT Estimation Formula Explained, With a Worked Example
PERT estimation combines optimistic, most likely and pessimistic guesses into one weighted duration, E = (O + 4M + P) / 6, with a full worked example.
The direct answer: PERT estimation replaces a single guessed duration with three numbers, optimistic, most likely, and pessimistic, combined into one weighted expected value: E = (O + 4M + P) / 6. The formula exists because the most common estimating mistake was never getting the number wrong, it was presenting one number at all. "This task will take 8 days" sounds confident. It is also almost certainly false, in the sense that it implies a precision nobody actually has.
Ask the same estimator for their best case and worst case and the truth comes out: 5 days if nothing goes wrong, 8 days if it goes about as expected, 15 days if the vendor's API documentation turns out to be wrong again, which it was the last two times. That spread, not the single number in the status report, is the honest estimate. PERT (Program Evaluation and Review Technique) turns the spread into one defensible number instead of a shrug.
TL;DR. PERT estimation asks for three numbers per task: optimistic (O), most likely (M), and pessimistic (P). The expected duration is E = (O + 4M + P) / 6, which weights the most likely case four times as heavily as either extreme. The spread between O and P also produces a standard deviation, (P − O) / 6, that tells you how much confidence to put in the number. Across a chain of tasks, expected durations add normally, but the standard deviations do not; you sum the variances first, then take the square root. The formulas take five minutes. Getting three honest numbers out of the person doing the work is the part that actually matters.
The three-point estimation formula, two ways
PERT (weighted): E = (O + 4M + P) / 6, standard deviation = (P - O) / 6
Triangular (simple average): E = (O + M + P) / 3, no extra weight on the most likely case
What Three-Point Estimation Fixes That a Single Number Can't
Once each uncertain task has an expected duration, a critical path calculation turns them into a schedule; PERT chart vs CPM walks through that hand-off on a four-task network.
A single-point estimate hides two different failure modes behind one number, and there's no way to tell which one you're looking at. An estimator who says "8 days" might mean "8 days, plus or minus half a day, this is routine work I've done fifty times." The same "8 days" might mean "8 days if the vendor's sandbox environment actually works this time, which it hasn't the last two attempts." Both estimates print identically in a Gantt chart. Only one of them deserves a contingency buffer.
Three-point estimation forces the estimator to surface the range they were already carrying around in their head but never wrote down. Optimistic is the case where nothing goes wrong: no blockers, no rework, the reviewer approves on the first pass. Pessimistic is the case where the known risks actually materialize, not a worst-case catastrophe, just the realistic bad version of this specific task. Most likely is what the estimator would actually bet on if pressed. Writing down all three doesn't create new information; it just stops the estimator from quietly deciding for you which failure mode "8 days" represents.
The PERT Formula: Why the Most Likely Estimate Gets 4x the Weight
PERT was developed in 1958 by the US Navy's Special Projects Office, Lockheed, and Booz Allen Hamilton for the Polaris submarine missile program, specifically to handle the duration uncertainty of research and development work that had never been scheduled before. The weighted-average formula behind PERT is:
E = (O + 4M + P) / 6
Where O is optimistic, M is most likely, and P is pessimistic. The most likely estimate carries four times the weight of either extreme, and the divisor is 6 because the weights (1 + 4 + 1) sum to 6.
The 4x weighting is not arbitrary. It approximates the mean of a beta distribution, a shape that fits task durations better than a normal (bell curve) or triangular distribution because real work is rarely symmetric. There are usually more ways for a task to run long (a dependency slips, a reviewer is out sick, the third-party API changes its rate limits) than there are ways for it to run dramatically short. A beta-shaped estimate captures that asymmetry; a straight average of the three numbers does not.
PERT also produces a standard deviation for each task, a measure of how much confidence to place in the expected value:
SD = (P − O) / 6
A tight spread between optimistic and pessimistic produces a small standard deviation, meaning the estimate is reliable. A wide spread produces a large standard deviation, meaning the expected value is a reasonable center point but the actual outcome could land far from it in either direction. Two tasks can share the same expected duration and mean completely different things for schedule risk if their spreads differ.
A Worked Example: From Three Guesses to One Defensible Number
Take the vendor API integration task from the opening. The estimator gives:
- Optimistic (O): 5 days, if the sandbox environment behaves and the first integration attempt works
- Most likely (M): 8 days, accounting for one round of back-and-forth with the vendor's support team
- Pessimistic (P): 15 days, if the documentation is wrong again and a workaround has to be reverse-engineered
Running the formula:
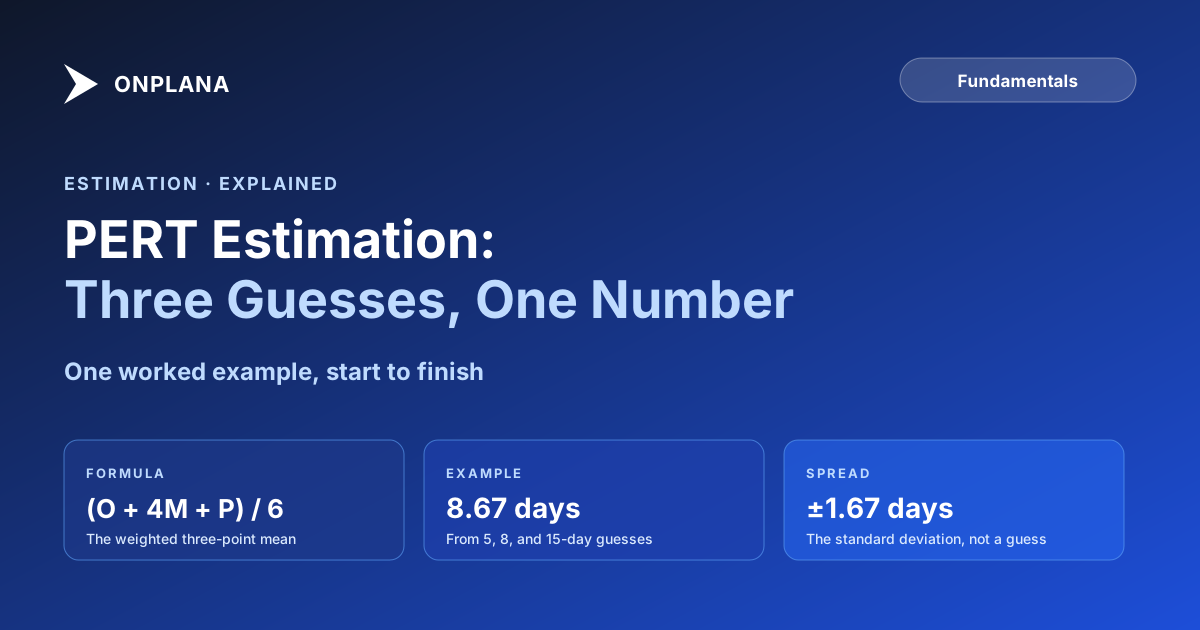
E = (5 + 4×8 + 15) / 6 = (5 + 32 + 15) / 6 = 52 / 6 ≈ 8.67 days
SD = (15 − 5) / 6 ≈ 1.67 days
Notice the expected value, 8.67 days, sits slightly above the most likely estimate of 8 days, not exactly on it. That's the pessimistic tail pulling the weighted average right: the gap from most likely to pessimistic (7 days) is larger than the gap from optimistic to most likely (3 days), so the distribution is skewed, and PERT's weighted formula reflects that skew instead of ignoring it the way a flat average of the three numbers would.
The diagram above shows why the expected value isn't just "the middle guess": it's pulled toward the heavier tail, and the shaded band marks the one-standard-deviation range you can quote alongside it. A single-point estimate of "8 days" would have thrown away both pieces of information.
PERT vs Triangular Distribution: Which Should You Use?
PERT is not the only way to combine three estimates. A triangular distribution uses a straight average, E = (O + M + P) / 3, with no extra weight on the most likely case. Run the same numbers through it: (5 + 8 + 15) / 3 = 9.33 days, noticeably higher than PERT's 8.67.
The difference matters because the two formulas encode different assumptions about the shape of uncertainty. Triangular distribution treats all three points as equally informative, which is a reasonable choice when you genuinely have no reason to expect the outcome to cluster near the most likely case. PERT assumes the most likely estimate is the best single predictor and the extremes represent tail risk, which is the more realistic assumption for most project work, where an experienced estimator's "most likely" case really is more probable than either extreme.
Use triangular distribution when the three points come from limited information and you don't trust the "most likely" judgment more than the extremes. Use PERT when the most likely estimate comes from someone with real domain experience on this specific type of task; the 4x weighting rewards that expertise instead of diluting it into a flat average.
| PERT (weighted) | Triangular (simple average) | |
|---|---|---|
| Formula | E = (O + 4M + P) / 6 | E = (O + M + P) / 3 |
| Weight on most likely | 4x either extreme | Equal to O and P |
| Result on the worked example | 8.67 days | 9.33 days |
| Best fit | Estimator has real domain experience; most likely case is a good predictor | Limited information; no reason to trust "most likely" over the extremes |
| Shape assumed | Beta distribution, skewed toward the tail with more risk | Symmetric around the three points |
| Standard deviation formula | (P − O) / 6 | Not standardized; PERT's SD is commonly reused |
How to Aggregate Three-Point Estimates Across a WBS
A single task's PERT numbers are only useful if they roll up correctly across a schedule. The rule that trips up most PMs: expected durations sum normally, but standard deviations do not.
- Sum the expected durations for every task on the chain. If a critical chain has four sequential tasks with expected durations of 8.67, 4.2, 6.5, and 3.1 days, the chain's expected duration is simply 8.67 + 4.2 + 6.5 + 3.1 = 22.47 days. This step is ordinary addition.
- Convert each task's standard deviation to a variance by squaring it. For the vendor API task, SD = 1.67, so variance = 1.67² ≈ 2.79.
- Sum the variances, not the standard deviations, across the chain. If the four tasks have variances of 2.79, 0.64, 1.21, and 0.36, the total variance is 5.00.
- Take the square root of the summed variance to get the chain's combined standard deviation. √5.00 ≈ 2.24 days.
- Build a confidence range from the combined expected duration and standard deviation. A roughly 90 percent confidence range uses about ±1.645 standard deviations: 22.47 ± (1.645 × 2.24) ≈ 18.8 to 26.2 days.
Step 1's shortcut, adding standard deviations directly instead of variances, is the single most common arithmetic error in schedule risk work. It overstates the combined uncertainty, because it assumes every task's risk is perfectly correlated with every other task's risk, when in reality independent risks partially cancel out. The variance-then-square-root method is correct only when the tasks' durations are statistically independent; if the same resource, the same vendor, or the same unresolved technical decision drives risk across several tasks at once, those tasks are correlated and the simple variance-sum understates the real combined uncertainty. Flag correlated risks separately rather than pretending the math handles them.
How Do You Present a Range to a Sponsor Who Wants One Date?
Sponsors ask for a date. Handing them a probability distribution instead, without translation, reads as evasion even when it's more honest. The fix isn't abandoning the range; it's presenting it in a form that still answers the question.
- Lead with a single recommended date, then show the range behind it. "October 14, with a realistic range of October 9 to October 22" gives the sponsor an anchor before the nuance.
- Frame the range as a confidence level, not a hedge. "There's roughly a 90 percent chance we finish by October 22" is a stronger sentence than "it could take longer," because it commits to a specific, falsifiable claim.
- Tie the range to the decision the sponsor actually needs to make. If the sponsor is deciding whether to announce a launch date publicly, the honest answer is the P80 or P90 date, not the optimistic one, because a public commitment that misses is more costly than a private one that runs long.
- Show where the pessimistic case comes from. "The pessimistic estimate assumes the vendor's documentation is wrong again, which happened on the last two integrations" is a specific, credible reason. A vague "pessimistic case" invites the sponsor to assume the team is padding.
- Update the range as the work progresses, and say so out loud. A range that gets narrower as uncertainty resolves is a sign of a team that is tracking reality. A range that never moves is a sign nobody is updating the estimate at all.
Where Three-Point Estimates Feed Into Monte Carlo Simulation
PERT's expected value and standard deviation are useful on their own, but they describe one task or one simple chain. Real schedules have branching paths, parallel work, and dozens of near-critical chains competing for the title of "the path that actually determines the finish date." That's the problem Monte Carlo simulation solves: instead of hand-calculating variance sums along a single chain, it runs the whole network thousands of times, sampling a duration from each task's distribution on every run, and returns a full probability curve for the project finish date rather than one derived range.
The three-point estimates in this post are exactly the inputs a Monte Carlo simulation needs per task. If you've already done the work of getting honest optimistic, most likely, and pessimistic numbers from your estimators, you're one step from a full schedule-level simulation instead of a single-chain approximation.
Common Mistakes That Quietly Break PERT Estimates
Anchoring all three numbers to the original single-point guess. If an estimator already committed to "8 days" before being asked for a range, their optimistic and pessimistic numbers tend to cluster tightly around 8 to avoid looking like they were wrong the first time. Ask for the three-point estimate before any single number is on the table, not after.
Treating a task estimated at Initial Concept the same as one estimated at Detailed Design. PERT's three numbers only capture task-level uncertainty; they say nothing about how much the whole project's estimate should still move as scope firms up. The cone of uncertainty covers that second, project-level source of error and the multiplier it shrinks by at each phase.
Treating the pessimistic case as a catastrophe instead of a realistic bad day. Pessimistic should mean "the known risks for this specific task actually happen," not "a meteor hits the data center." A pessimistic estimate that's wildly inflated produces a standard deviation so large it's useless for planning.
Summing standard deviations instead of variances across a chain. Covered above, and worth repeating because it's the error that survives review most often; it looks like reasonable arithmetic and produces a plausible-looking, wrong number.
Applying three-point estimation to every task regardless of actual uncertainty. A task the team has done fifty times identically doesn't need three numbers; the extra step adds process overhead without changing the schedule risk conversation, and it trains estimators to stop taking the exercise seriously.
Never revisiting the range once work starts. A three-point estimate made in planning and never updated against real progress is a prediction nobody is checking. Reforecast the range at each status update using what's actually been learned about the task, the same way you'd reforecast a project plan against real progress instead of the original assumptions. Running the free Schedule Health Check against the current .mpp file is a fast way to see which tasks have drifted furthest from their original range before the next status update.
The math behind PERT is five minutes with a calculator. The discipline is getting three honest numbers instead of one confident-sounding guess, and then having the reporting cadence to update the range as the work actually happens. Tasks that matter for the finish date, the ones sitting on or near the critical path, are exactly the tasks worth spending that five minutes on. This post sits alongside the rest of the scheduling fundamentals library, including the work breakdown structure guide for building the task list PERT operates on in the first place.
Run the free Schedule Health Check Upload a .mpp file and see which tasks have drifted furthest from their planned range, plus the other risk flags a manual review misses. → Open the Schedule Health Check
Frequently asked questions
What is the three-point estimation formula?
PERT's weighted formula is E = (Optimistic + 4 x Most Likely + Pessimistic) / 6. A simpler triangular average, E = (O + M + P) / 3, is the alternative when you don't want to weight the most likely case more heavily.
What is PERT estimation?
PERT (Program Evaluation and Review Technique) estimation replaces a single guessed duration with three estimates, optimistic, most likely, and pessimistic, combined into one weighted expected value. It converts an admission of uncertainty into a defensible number instead of hiding that uncertainty behind false precision.
How is PERT different from a triangular distribution?
A triangular distribution weights all three points evenly, giving a mean of (O + M + P) / 3. PERT's beta-based weighting pulls the expected value closer to the most likely estimate, which fits real task durations better because extreme outcomes are usually rarer than a straight average assumes.
How do you combine three-point estimates across a schedule?
Expected durations add normally along a chain of tasks. Variances add too, but standard deviations do not, so you sum the variances (the squared standard deviations) for every task on the chain, then take the square root of that total to get the chain's combined standard deviation.
When is three-point estimation overkill?
On tasks the team has done many times identically, where the duration is genuinely well known. Reserve three-point estimation for tasks with real uncertainty: novel work, unfamiliar vendors, unproven technical approaches, and anything sitting on or near the critical path.
Ready to make the switch?
Start your free Onplana account and import your existing projects in minutes.