
Reporting and Dashboards: Onplana vs Project Online
Project Online reporting needs Power BI for portfolio dashboards. Here is what each tool ships natively and when the Power BI investment still pays off.
Most Project Online evaluation pages tell you to build your dashboards in Power BI. What they omit is the operational reality: someone at your organization has to build those Power BI reports, someone has to own the data model, someone has to update the reports when the OData schema changes after a PWA update, and all of this has to happen before a portfolio dashboard exists for anyone to look at.
For organizations with a mature BI practice and a dedicated Power BI developer, this is a reasonable division of labor. For the majority of mid-market PMOs that do not have that infrastructure, the sentence "use Power BI" translates in practice to "your PMO director will spend Tuesday afternoon in Excel, again."
Project Online reporting relies on Power BI for anything beyond basic PWA list views. The combination works well when a BI team maintains the reports, but it creates a development dependency that most mid-market PMOs underestimate. Onplana ships a drag-and-drop dashboard builder with 18 widget types: Gantt snapshots, milestone timelines, resource heatmaps, budget burn charts, risk summaries, and cross-project rollups, all available without a separate BI tool. Power BI still wins for complex multi-source analytics, advanced DAX modeling, and executive reporting that spans PMO and non-PMO data. Both models are valid; the choice comes down to whether your organization can sustain a Power BI practice alongside your PM tool.
How Project Online reporting actually works
Project Online reporting is built on two layers: the PWA interface and the OData reporting endpoint.
The PWA interface ships built-in views for project lists, task status, resource utilization, and timesheet summaries. These are functional for individual project-level queries, but they are not portfolio dashboards in any meaningful sense. A PMO director who wants to see the status of all 40 projects in the portfolio, color-coded by milestone health, with resource utilization rolled up to the portfolio level, cannot get that from a PWA default view. They need a report.
The OData endpoint is Project Online's reporting data service. It exposes every project, task, assignment, baseline, resource, and custom field in the PWA tenant as queryable OData entities. Microsoft's Project Online connector for Power BI connects to this endpoint and pulls the data into a Power BI semantic model. From there, a Power BI developer builds the reports, defines DAX measures for KPIs like schedule variance and cost performance index, and publishes the finished reports to Power BI Service.
This architecture is powerful. A skilled Power BI developer with access to the Project Online connector can build reports that rival purpose-built BI tools: cross-project milestone dashboards, resource utilization heatmaps, earned value management charts, and executive scorecards that surface the right numbers for each audience. The reports can embed in SharePoint pages inside the PWA site collection, making them accessible to users without a Power BI Pro license.
The catch is everything that has to happen before the first report renders. Setting up the OData connection requires credentials with the right Project Online permissions. The semantic model needs to be built with the right relationships between the OData entity types. The OData query limits (300 projects, 1,000 resources, 300 tasks by default) require pagination strategies for large tenants. Refresh schedules need to be set up and monitored. And every PWA update that changes the OData schema risks breaking the reports silently until someone notices the data stopped refreshing correctly.
The Power BI dependency in practice
The development dependency is the primary cost most PMOs underestimate when evaluating Project Online reporting.
Power BI report development is not a self-service task for most PMs. Building a well-structured semantic model requires understanding of the Project Online OData entity relationships: Project to Task, Task to Assignment, Assignment to Resource, Resource to Timesheet. Writing DAX measures for schedule variance, cost performance index, and forecast-at-completion requires Power BI expertise beyond what most PMs carry.
Organizations that have already built Power BI reports for Project Online have usually paid for that investment once. The reports exist, they work, and the organization has someone who knows how to maintain them. For these organizations, the reporting capability is a genuine strength of the Project Online architecture.
Organizations that have not built Power BI reports yet face a choice at migration time: invest in the development work required to get meaningful reporting from Project Online (adding cost and time to an already compressed migration window), or move to a tool where portfolio reporting is available without a BI development cycle.
The additional complication specific to the September 2026 migration window is timeline. Building a meaningful Power BI reporting layer for Project Online typically takes four to eight weeks, depending on the number of report types, the complexity of the OData relationships, and the availability of someone with the relevant skills. Organizations that have not yet built this layer and are approaching the retirement deadline face a choice: invest in Power BI reporting for a tool they are leaving in months, or redirect that effort toward configuring reporting in their destination tool.
What Onplana's built-in reporting ships
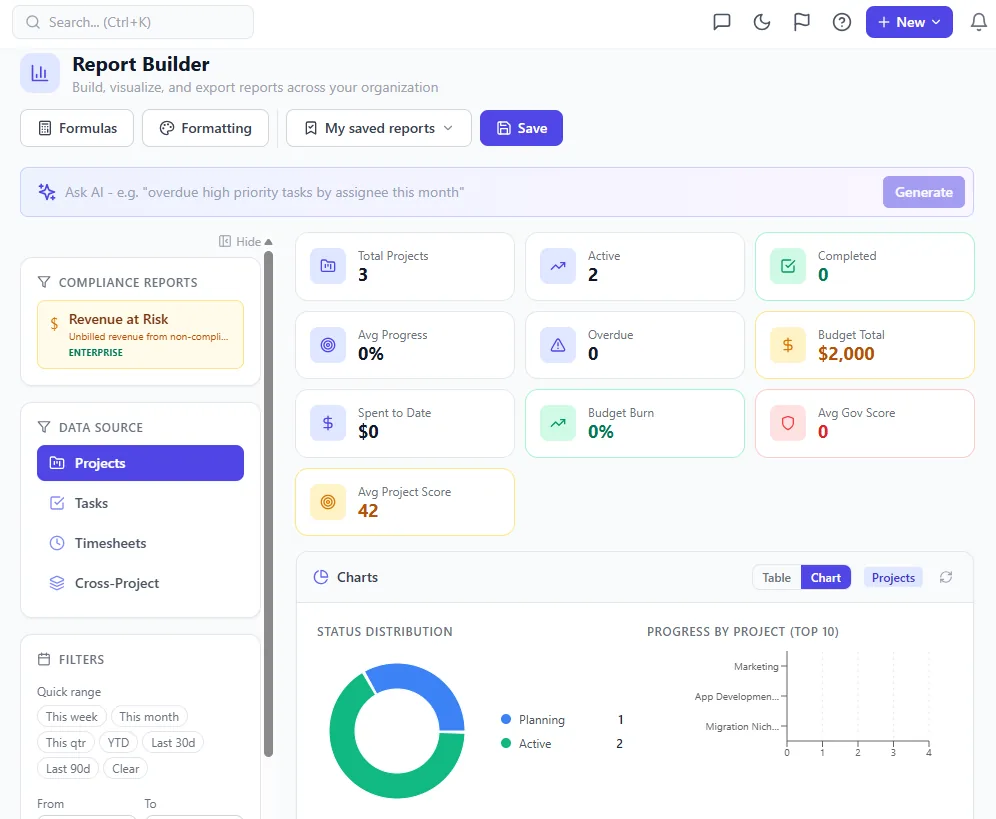
The cross-project report builder: pick widgets from the palette, drop them on the canvas, scope by portfolio or filter. No Power BI workspace, no dataset refresh schedule, no DAX.
Onplana's dashboard builder is a drag-and-drop interface with 18 widget types, covering the full reporting surface area most PMO portfolios need without a BI development dependency.
The standard widget types include:
Portfolio-level views. Project status table with RAG indicators; milestone timeline across all projects; portfolio health scorecard with configurable KPIs; budget burn chart aggregated across the portfolio.
Schedule and progress tracking. Gantt snapshot widget for individual projects; critical path summary; baseline vs actual comparison charts; completion percentage bars by project or phase.
Resource and capacity. Cross-project resource utilization heatmap (same data as the resource pool, surfaced as a dashboard widget); allocation breakdown by role; capacity vs demand chart for the next 90 days.
Risk and issue visibility. Risk register summary with probability-impact matrix; open issues count by project and owner; escalation status overview.
Custom field rollups. Any enterprise custom field can be aggregated into a dashboard widget, allowing PMOs to surface domain-specific KPIs (delivery confidence scores, regulatory milestone status, contract value at risk) without custom development.
Dashboards are configurable at the portfolio, program, and project level, so a PMO director sees the full portfolio view while individual PMs see their project-level detail. Access control is role-based: a resource manager sees the utilization widgets; an executive sees the scorecard and milestone summary.
Onplana vs Project Online: reporting feature comparison
The diagram below shows the reporting stack for each tool, from raw project data to the dashboard a resource manager or PMO director sees.
| Reporting capability | Project Online | Onplana |
|---|---|---|
| Built-in portfolio dashboard | No (Power BI required) | Yes (18 widget types) |
| Cross-project KPI rollups | Power BI with DAX measures | Native widget configuration |
| Resource utilization dashboard | Power BI or Resource Center | Built-in heatmap widget |
| Milestone timeline across projects | Power BI or manual export | Native milestone timeline widget |
| Earned value / schedule variance | Power BI (DAX required) | Built-in EVM widgets |
| Custom field aggregation | Power BI with OData mapping | Native custom field rollup |
| Status report generation | Manual (PWA views + email) | AI-assisted status report writer |
| Embedded in project tool | Via SharePoint web parts | Native, same interface |
| Data freshness | OData sync (minutes to hours lag) | Real-time (live project data) |
| Developer dependency for setup | Yes (Power BI developer) | No |
| Cost to get first dashboard | Power BI Pro + dev time | Zero additional cost |
When Power BI is still worth the investment
There are genuine cases where Power BI remains the right reporting choice, including when running Onplana.
Multi-source executive reporting. When the executive team needs a single dashboard that combines PMO data with ERP cost actuals, HR headcount data, and sales pipeline from CRM, Power BI's multi-source modeling capabilities are the right tool. Onplana's built-in dashboards show PMO data only. Cross-domain analytics require a BI layer regardless of which PM tool you use.
Advanced financial modeling. For organizations that track earned value with complex cost accrual rules, variance-at-completion with custom adjustment logic, or multi-year budget modeling that spans fiscal years with non-calendar boundaries, Power BI DAX provides the calculation flexibility that fixed-widget dashboards cannot match.
Regulatory reporting with defined formats. Some industries (defense, government contracting) require earned value reporting in formats defined by contract or regulation (ANSI/EIA-748, CDRL deliverables). These formats cannot be satisfied by a general-purpose dashboard builder; they require custom report templates that Power BI can produce with the right model behind them.
Organizations already operating a Power BI Center of Excellence. If your organization has Power BI Pro licenses deployed broadly, a BI team that maintains existing reports, and a governance model for data sources and semantic models, adding Onplana as a Power BI data source via the REST API is a natural extension of what already exists. You are not adding overhead; you are adding a data source.
How status reporting changes when you move off Project Online
Status reports in most Project Online environments follow a predictable pattern: the PM assembles data from PWA views, writes a narrative in a PowerPoint template or SharePoint page, and distributes by email. The process takes 30 to 90 minutes per PM per week, depending on the complexity of the project and the expectations of the sponsor.
The underlying data quality problem with this workflow is the one covered in discipline around goals, milestones, and status reporting: status reports describe what the PM believes rather than summarizing what the schedule says. When the process is manual, the PM's judgment fills every gap.
Onplana's approach generates a structured status report directly from live project data: milestone status pulled from the actual schedule, resource allocation pulled from the current assignments, budget burn pulled from the cost tracking. The PM reviews and edits the output before publishing, but they are editing a draft that reflects the schedule rather than writing from scratch. The status report writing guide covers what that output should include and how to keep it useful to different audiences.
For distributed teams or high-frequency reporting schedules (daily standups, weekly portfolio reviews), the difference between starting from a data-driven draft versus starting from scratch compounds quickly.
The free Status Report Writer lets any PM or PMO generate a structured status report without leaving the project data they already have. It works independently of your PM tool and can help teams bridge the reporting gap during migration, when Project Online data and destination tool data are both live simultaneously.
Reporting migration considerations
When migrating from Project Online, the reporting inventory deserves its own migration plan alongside the schedule and resource data migration.
Catalog existing Power BI reports before committing to a destination tool. Identify which reports are actively used, which are maintained, and which were built three years ago and nobody looks at anymore. The active, maintained reports are what matter. For each one, determine whether it can be rebuilt in the destination tool's native dashboard builder or whether it genuinely requires Power BI to replicate.
In our experience, most PMOs find that 70-80 percent of their actively used reports can be rebuilt natively in a modern PM tool's dashboard builder. The 20-30 percent that require Power BI tend to be the executive scorecard reports that combine PMO data with financial or HR data, precisely the use case where a BI tool is the right choice regardless of PM tool.
Use the free Status Report Writer Generate a structured status report from your project data in minutes. Works during and after migration. No signup required. Open the Status Report Writer
Microsoft Project Online™ is a trademark of Microsoft Corporation. Onplana is not affiliated with Microsoft.
Ready to make the switch?
Start your free Onplana account and import your existing projects in minutes.