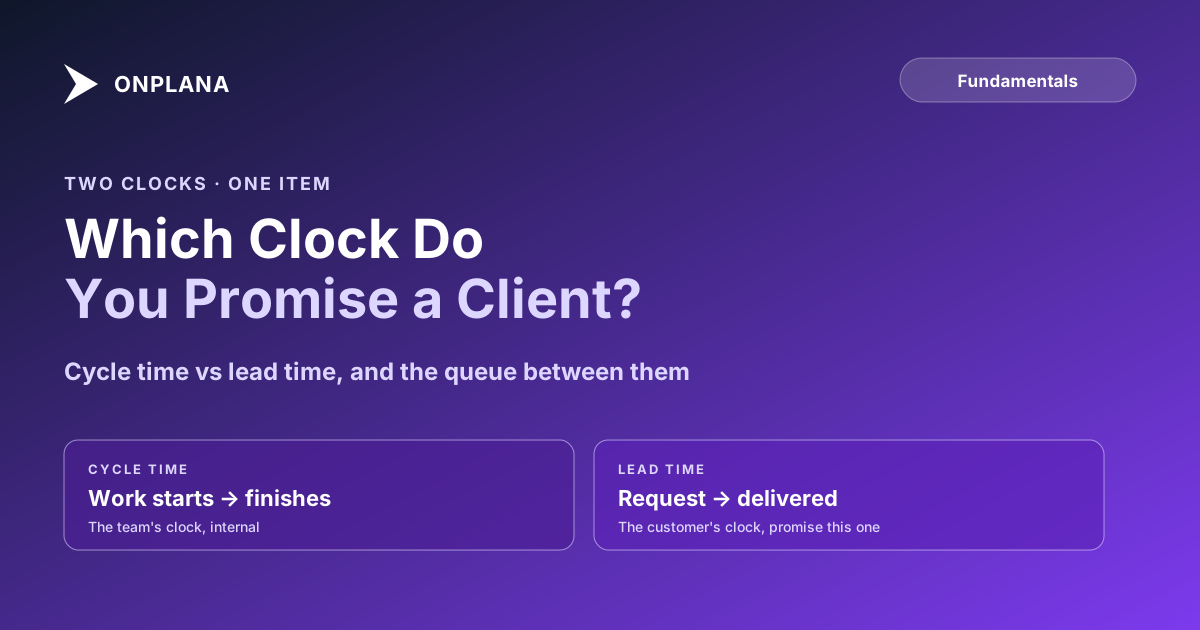
Cycle Time vs Lead Time, and Which One to Promise a Client
Cycle time vs lead time: cycle time starts when work begins, lead time starts when the customer asks, and the gap between them is the queue nobody measures.
Ask a team if delivery has gotten faster and they'll often point to a cycle time chart trending down for months. Ask their customers the same question and the answer is frequently the opposite. Both can be true at once, because cycle time and lead time measure two different clocks, and only one of them is the clock the customer is actually watching.
The direct answer: cycle time measures from the moment work starts on an item to the moment it finishes; lead time measures from the moment the request was made, including any time it sat waiting, to the moment it's delivered. Lead time is always equal to or longer than cycle time, and the gap between them is queue time, the interval between "someone asked" and "someone started." A team optimizing cycle time alone can watch that number improve for a year while lead time gets worse, because tightening what happens after work starts does nothing about how long a request waits before anyone picks it up. This is why DORA's own delivery metrics track "change lead time," defined as the time from a change committed to version control to that change running in production, rather than a pure cycle-time number: the metric that gets reported is deliberately the one that includes the wait, not just the work.
In short. Cycle time is the team's clock: work-started to work-finished. Lead time is the customer's clock: request-made to delivered. The difference is queue time. If you're promising a delivery date to anyone outside the team, promise lead time, because that's the number they'll actually experience; cycle time alone hides the wait they spend not knowing anyone has started.
Cycle Time vs Lead Time: Two Clocks, One Item
Every piece of work has both numbers attached to it, and they start at different moments.
| Metric | Starts when | Ends when | Who experiences it |
|---|---|---|---|
| Cycle time | Work actually begins (pulled into "in progress") | Work finishes | The team, internally |
| Lead time | The request is made (ticket filed, ask received) | The item is delivered | The customer or requester |
| Queue time | The request is made | Work actually begins | Invisible to both, unless measured directly |
Cycle time is a subset of lead time. If a request sits for five days before anyone starts on it, then takes three days of actual work, cycle time is three days and lead time is eight. A dashboard that only shows cycle time reports "3 days," which is accurate and also not what the requester experienced.
Why the Two Numbers Diverge
The divergence almost always comes from an unmanaged intake queue. WIP limits cap how much work is actively in progress, which is good discipline and genuinely lowers cycle time by Little's Law: less work in progress at a constant throughput means less time each item spends being actively worked. But a WIP limit says nothing about how long a request waits in the backlog before it's pulled into that capped stage. Tighten the cap without also watching the backlog, and requests can queue longer even as the in-progress metric improves, because the same completion rate is now spread across more of a wait that isn't being tracked at all.
This is the exact failure mode a cumulative flow diagram catches if the backlog is included as its own band. A backlog band that widens while the in-progress band holds steady is queue time growing in plain sight, weeks before it shows up as customers asking where their request went.
The chart below plots both clocks for the same eight requests, showing where each one starts.
Both bars describe the same eight-week request. The team's internal chart, cycle time only, would show a healthy three weeks. The customer's actual wait, lead time, was six. Neither number is wrong; they're answering different questions, and only one of them is the question the customer asked.
Measuring Lead Time Without Guessing
- Timestamp the request the moment it arrives, not the moment someone triages it. A ticket filed on Monday and triaged on Thursday has a lead-time clock that started Monday.
- Timestamp delivery, not "marked done." If a completed item sits waiting for deployment or sign-off, lead time hasn't ended until the customer actually has it.
- Track queue time as its own number, the gap between the two timestamps above, rather than inferring it. A queue that's growing is the earliest signal that lead time is about to diverge from cycle time.
- Report lead time externally, cycle time internally. A sponsor or client cares about the number that matches their experience; a team improving its own process cares about the number it directly controls.
- Watch both trends, not just their current values. Cycle time improving while lead time flattens or worsens is the specific pattern that means the queue is the actual bottleneck, not the workflow.
Which Number to Promise
Promise lead time. It's the number a customer or stakeholder can verify against their own experience, and a lead time promise implicitly accounts for the queue, which a cycle time promise doesn't. If a request sits for a week before anyone starts and the team then delivers in two days, a cycle-time-based promise of "two days" is technically true and will read as a broken commitment to whoever waited the full nine.
Reserve cycle time for internal process improvement conversations, where the team controls the variable it's measuring. Reducing WIP, catching bottlenecks earlier with a cumulative flow diagram, and applying Little's Law to forecast the effect of taking on more work are all cycle-time-side interventions. None of them touch queue time on their own, which is why a team serious about the number customers actually feel needs to manage the backlog as deliberately as it manages the workflow.
Run the free Status Report Writer Turn this week's actual cycle time and delivery dates into a status update that reports the number your stakeholders experience, not just the one your board tracks. No signup required. → Open the Status Report Writer
Frequently asked questions
What is the difference between cycle time and lead time?
Cycle time measures from when work actually starts on an item to when it finishes. Lead time measures from when the request was made, including any time it waited before work started, to when it's delivered. Lead time is always equal to or longer than cycle time.
Which one should I promise a customer or stakeholder?
Lead time. A customer experiences the whole wait from asking to receiving, including the queue time your team's cycle time metric doesn't count. Promising cycle time promises a number the customer never actually observes.
Why does my delivery feel slow even though cycle time is improving?
Because the queue before work starts is growing faster than cycle time is shrinking. Teams that only track cycle time can watch it improve for months while lead time, and the customer's actual experience, gets worse, because nobody's measuring how long items wait before anyone picks them up.
How do you measure lead time in practice?
Timestamp the request the moment it's made, whether that's a ticket filed, an email received, or a task added to a backlog, then timestamp delivery. The difference is lead time. It requires capturing the request moment, which teams that only instrument their workflow board tend to miss.
Can cycle time improve while lead time gets worse?
Yes, and it's the most common way flow metrics mislead a team. If work-in-progress caps get tighter (a good thing for cycle time) while the intake queue grows unmanaged, items spend less time being worked and more time waiting to be started, and the customer sees only the total.
Does Little's Law apply to lead time the same way it applies to cycle time?
Yes, if you draw the system boundary around the whole request-to-delivery journey rather than just the active workflow. Include the queue as part of work in progress, and Little's Law's WIP-equals-throughput-times-time relationship holds for lead time exactly as it does for cycle time inside the workflow alone.
Ready to make the switch?
Start your free Onplana account and import your existing projects in minutes.