PM Tool Total Cost of Ownership: What It Hides
PM tool total cost of ownership includes migration, training, and admin overhead the license price hides; the cheapest seat fee often costs the most.
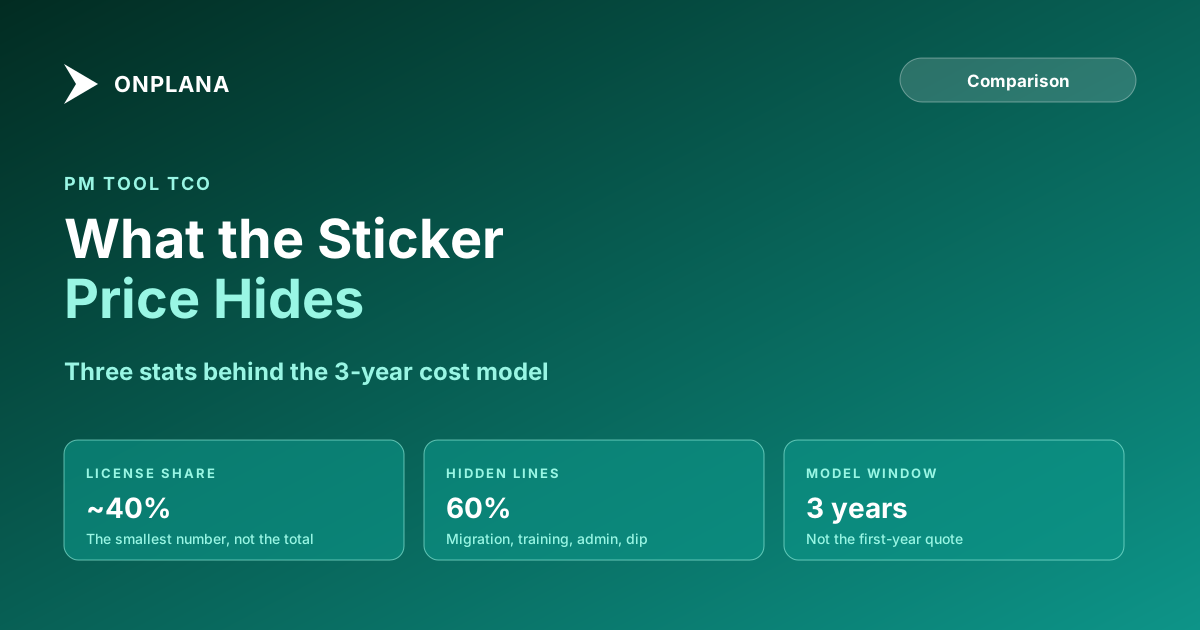
The cheapest line item in most PM tool budgets is the one everyone argues about: the license fee. It's also usually the smallest number in the three-year total.
PM tool total cost of ownership is the license price plus implementation and data migration, integration rework, training, and the ongoing admin overhead of running the tool, and over three years the non-license items typically outweigh the license itself. A tool that's 15% cheaper per seat but weaker on migration fidelity or governance can cost more once those hidden line items are counted.
The short version License price is one line in PM tool TCO, not the whole model; implementation, migration, training, and admin overhead are usually larger combined. The cheapest sticker price often has the highest TCO, because gaps in import fidelity and governance get pushed into workarounds and admin time instead. Model three years, not one: the admin-overhead line recurs every month for the life of the contract.
PM Tool Total Cost of Ownership: The Line Items a Sticker Price Doesn't Show
Total cost of ownership as a concept predates software: it exists precisely because a purchase price and the full cost of owning something are different numbers in any category, not just PM tooling. A per-seat price answers one question: what does the license cost. It doesn't answer what it costs to get your existing schedules, resource pools, and reports into the new tool, what it costs to train a PMO to use it well, or what it costs in admin hours every month once it's live. Those three categories, plus integration rework for whatever the tool doesn't connect to natively, make up the rest of TCO, and none of them appear on a pricing page.
| TCO line item | What drives the cost | Typical share of 3-year TCO |
|---|---|---|
| License fees | Seat count × per-seat price × 36 months | 35-45% |
| Implementation and data migration | Import fidelity, how much manual re-entry is needed | 15-25% |
| Integration rework | Rebuilding reports and connections the old tool fed | 5-10% |
| Training | Hours per PM, plus lost productivity during ramp-up | 5-10% |
| Admin overhead | Ongoing permissions, support tickets, workflow upkeep | 15-20% |
| Productivity dip during changeover | Weeks of reduced throughput industry-wide during cutover | 5-10% |
The diagram below shows a representative split for a 50-seat PMO evaluating a three-year contract. License is the largest single line, but the other five combined outweigh it.
Why the Cheapest License Often Has the Highest TCO
The mechanism is straightforward: a tool priced below the market usually got there by shipping less, and the gap doesn't disappear, it moves. Weak native import means more manual re-entry during implementation. Thin governance means more admin hours spent on workarounds instead of configuration. Missing integrations mean a report someone has to rebuild by hand every week instead of once. Every one of those gaps shows up as a cost somewhere in the model; it just shows up in a different row than "license," which is exactly why a checklist comparison of per-seat prices misses it. The same trap shows up specifically in a Project Online context, where the three-year TCO model for staying on a retiring platform runs the identical exercise against a fixed deadline.
Modeling Your Own Three-Year TCO
- List every candidate's per-seat price at your actual seat count, not the marketing page's smallest tier.
- Get an implementation estimate in hours, not a vague "we'll help you migrate." Ask specifically how custom fields, dependencies, and historical data are handled.
- Price training at hours per PM times a realistic hourly cost, including the ramp-up weeks where output is lower.
- Estimate monthly admin hours once live: permissions, support tickets, workflow maintenance. This is the line most buyers guess low on.
- Multiply by 36 months and sum every row. Compare totals, not per-seat stickers.
What Changes the Model Most
Two variables move the total more than any other line: seat count growth and admin-hour estimates. A tool that looks competitive at today's headcount can become the expensive option if it caps projects or storage at a tier that forces an upgrade within the contract term, which is why it's worth checking a vendor's actual plan limits rather than the launch tier alone; Onplana's Free tier, for instance, caps at 5 members and 2 projects, while Starter at $7 per seat per month opens that to 25 and 25. And because admin overhead recurs every month for the life of the contract, a small underestimate there compounds faster than any other line in the model.
For the general build-vs-buy question that sits upstream of this decision, see build vs buy project management: the real cost. And when the cost comparison specifically involves an active migration, the free Migration Cost Calculator models the multi-year number against your actual seat count and current spend in a few minutes, no signup required.
Model your migration cost before you commit to a tool Enter your seat count and current spend and get a three-year cost comparison you can bring to budget review. No signup required. → Open the Migration Cost Calculator
Frequently asked questions
What is included in PM tool total cost of ownership?
License fees, implementation and data migration, integration rework, training, ongoing admin overhead, and the productivity dip during changeover. License is typically the smallest of these over a three-year horizon, not the largest.
Why does the cheapest PM tool license often have the highest TCO?
Because a lower-priced tool that lacks native import fidelity, governance, or reporting pushes those costs into implementation, workarounds, and admin time instead of the license line, and those hidden costs usually exceed what the cheaper license saved.
How do I model three-year TCO across PM tool candidates?
Build one spreadsheet per candidate with rows for license, implementation and migration, training, integration rework, and estimated admin hours per month, then multiply by 36 months and compare the totals, not the per-seat sticker price alone.
What's the single most underestimated line item in PM tool TCO?
Admin overhead: the ongoing hours a PMO or IT admin spends on permissions, integrations, and support tickets. It's recurring every month for the life of the contract, while implementation and training are one-time costs teams remember to budget.
Ready to make the switch?
Start your free Onplana account and import your existing projects in minutes.