Utilization vs Billability: The Target Trap
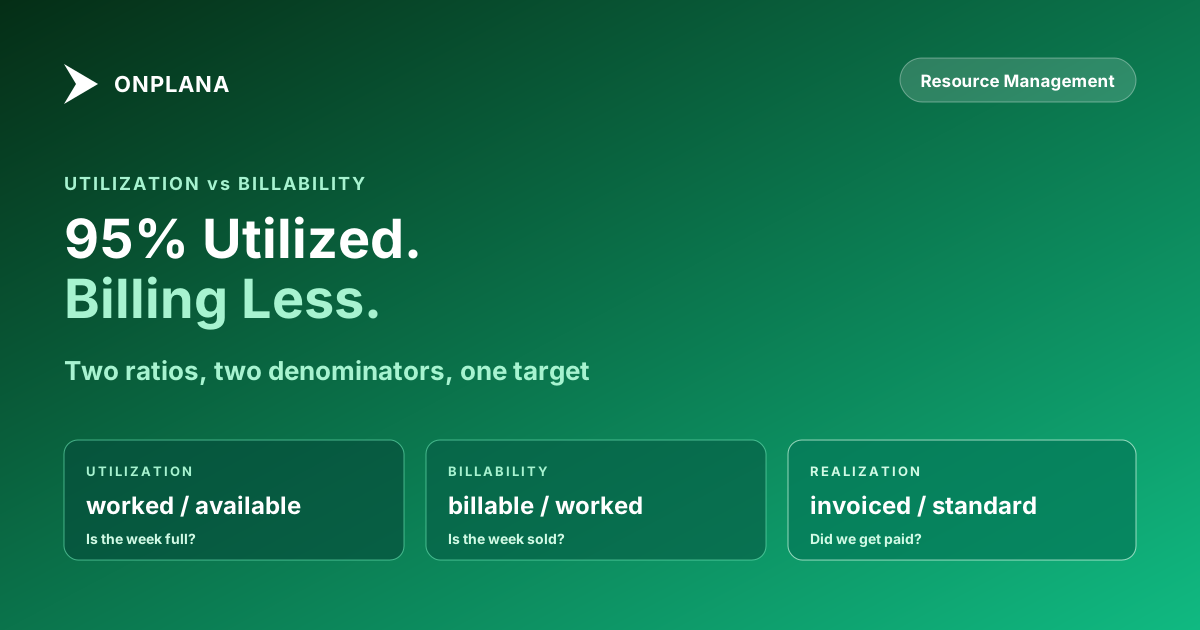
Utilization vs billability: two ratios with different denominators, routinely set as one target. That is how a team hits 95% utilization while revenue falls.
A consultancy can raise utilization from 90% to 95% and bill less money that month. That is not a paradox and it is not a reporting error. It is what happens when two different ratios get reported as one target.
Utilization vs billability is the distinction that explains it. Utilization is hours worked divided by hours available. Billability is billable hours divided by hours worked. The numerator of one is the denominator of the other, which means a person can move both numbers in opposite directions without doing anything wrong.
The direct answer: Utilization measures how full someone's week is; billability measures how much of that full week a client pays for. Because they have different denominators, working longer on internal work raises utilization and lowers billability at the same time. Billable utilization is the product of the two, and realization rate is the third number that catches the revenue the first two cannot see.
Utilization vs Billability: What Is the Difference?
Both are ratios of hours, which is why they get conflated, and they answer different questions.
| Utilization | Billability | Billable utilization | Realization | |
|---|---|---|---|---|
| Numerator | Hours worked | Billable hours | Billable hours | Revenue invoiced |
| Denominator | Hours available | Hours worked | Hours available | Billable hours at standard rate |
| Question it answers | Is the week full? | Is the week sold? | Is capacity earning? | Did we get paid for it? |
| Rises when | People work more | Less internal work | Both improve | Fewer discounts and write-offs |
| Blind to | Whether the work is billable | How full the week is | Discounts and write-offs | Everything upstream |
The fourth column is the one most firms mean when they say "utilization", and it is the product of the first two. A person at 95% utilization and 68% billability is at roughly 65% billable utilization, which is a perfectly ordinary number, while the 95% on the dashboard suggests something excellent is happening.
How Can Utilization Rise While Revenue Falls?
Follow one consultant with a 40-hour week across two months. The arithmetic is small enough to check by hand, which is the point.
Month A. Works 36 hours, of which 32 are billable. Utilization is 36 divided by 40, or 90%. Billability is 32 divided by 36, or 89%. At a $200 standard rate that is $6,400 of billable work.
Month B. A methodology rewrite lands, plus two internal reviews. Works 38 hours, of which 26 are billable. Utilization is 38 divided by 40, or 95%. Billability is 26 divided by 38, or 68%. That is $5,200 of billable work.
Utilization went up five points. Billable hours fell by six, and $1,200 went with them. A dashboard showing only the first number reports Month B as the better month, and whoever is being measured on it has learned the fastest way to look good is to book time to something rather than to sell more work.
What Does a Healthy Mix Actually Look Like?
Work backwards from the number that pays salaries rather than forwards from a target.
A firm needing $6,000 a month of billable work per consultant at a $200 rate needs 30 billable hours. Against a 40-hour week that is 75% billable utilization, which can be reached as 94% utilization with 80% billability, or as 83% utilization with 90% billability. The second is the healthier firm: people are working a sane week and almost all of it is sold. The first is a firm that is busy, and the difference between busy and sold is exactly what one number hides.
That also shows why a utilization target above roughly 90% is self-defeating. The remaining 10% is where training, proposals, internal reviews and hiring live. Squeeze it and those things do not stop happening, they get logged as billable, which corrupts the data the whole model depends on and eventually shows up as a write-off.
Which Third Metric Keeps the Pair Honest?
Realization rate, and it is the one most often missing.
Realization is revenue actually invoiced divided by the standard-rate value of the billable hours. If Month B's 26 billable hours were worth $5,200 at standard rate but the client was invoiced $4,160 after a scope discount, realization is 80% and the real revenue is $4,160. Neither utilization nor billability can see that gap, because both stop counting at the point the hours are logged.
Discounts, goodwill write-offs and hours the client refuses are all invisible upstream. A firm tracking only the first two metrics can run a quarter where every dashboard is green and the bank balance disagrees, which is the situation Revenue at Risk, derived from missing timesheets approaches from the other direction: hours never logged at all.
How Do You Measure All Three Without a New System?
Three conditions, and they are the same three for every metric above.
- Hours logged against real work, not into a separate timesheet tool. If logging is a Friday-afternoon reconstruction, every ratio here is a reconstruction too. Timesheet compliance without nagging covers getting that right without turning it into a discipline problem.
- Every project marked billable or internal. Billability is undefined without it, and the default of treating everything as billable is what produces the flattering number.
- A rate card carrying both a cost rate and a billable rate. Cost times hours gives you cost; billable rate times hours gives you the standard-rate value that realization divides into.
With those in place the three ratios are arithmetic rather than a reporting project. Engineering consultancies feel this most, and what to test in engineering project management software shows where the numbers usually come from. Onplana carries rate cards with the cost-versus-billable split on every plan including the free one, with timesheets and the billable capacity view at Pro, so the mix can be checked before committing to anything. For the capacity side of the same question, resource capacity forecasting covers projecting the available-hours denominator rather than measuring it after the fact, and the resource manager handbook puts both into a weekly routine.
The single most useful change most firms make is not a new tool. It is deleting the standalone utilization target from the dashboard and replacing it with the pair, because a number nobody can game is worth more than a number everybody can.
Frequently asked questions
What is the difference between utilization and billability?
Utilization is hours worked divided by hours available; billability is billable hours divided by hours worked. They share a numerator boundary but have different denominators, which is why one can rise while the other falls.
Can utilization go up while revenue goes down?
Yes, and it is common. A consultant who works longer hours on non-billable internal work raises utilization and lowers billable hours at the same time, so the headline number improves while the invoice shrinks.
What is a good billable utilization rate?
Industry benchmarks for professional services sit a little under 70% for billable utilization, which is the product of the two ratios rather than either one alone. Chasing a number above that usually means measuring the wrong ratio rather than performing better.
What is realization rate and why does it matter?
Realization is revenue actually invoiced divided by the standard-rate value of the billable hours. It catches discounts and write-offs, which are invisible to both utilization and billability, and it is the metric that stops a firm celebrating hours it never got paid for.
Should we set a utilization target at all?
Set one, but never alone. A single utilization target is the specific mistake this article is about, because the cheapest way to hit it is to book time to something rather than to sell more work. Pair it with billability and realization and the incentive to game it disappears.
How do we measure these without buying another system?
All three come from the same source: hours logged against real work, with each project marked billable or internal, and a rate card carrying both a cost rate and a billable rate. If those three things are true, the ratios are arithmetic rather than a data project.
Ready to make the switch?
Start your free Onplana account and import your existing projects in minutes.