Measuring AI Agent Productivity: Four Metrics That Hold
Measuring AI agent productivity by output volume is the easiest number to report and the wrong one. Four metrics that actually predict whether it's helping.
Measuring AI agent productivity by output volume is the easiest number to report and the most useless one to act on: how much did the agent produce. It's the number every dashboard already tracks, drafts generated, tickets touched, comments posted, and it's trivial to make go up without the team actually getting anything more done.
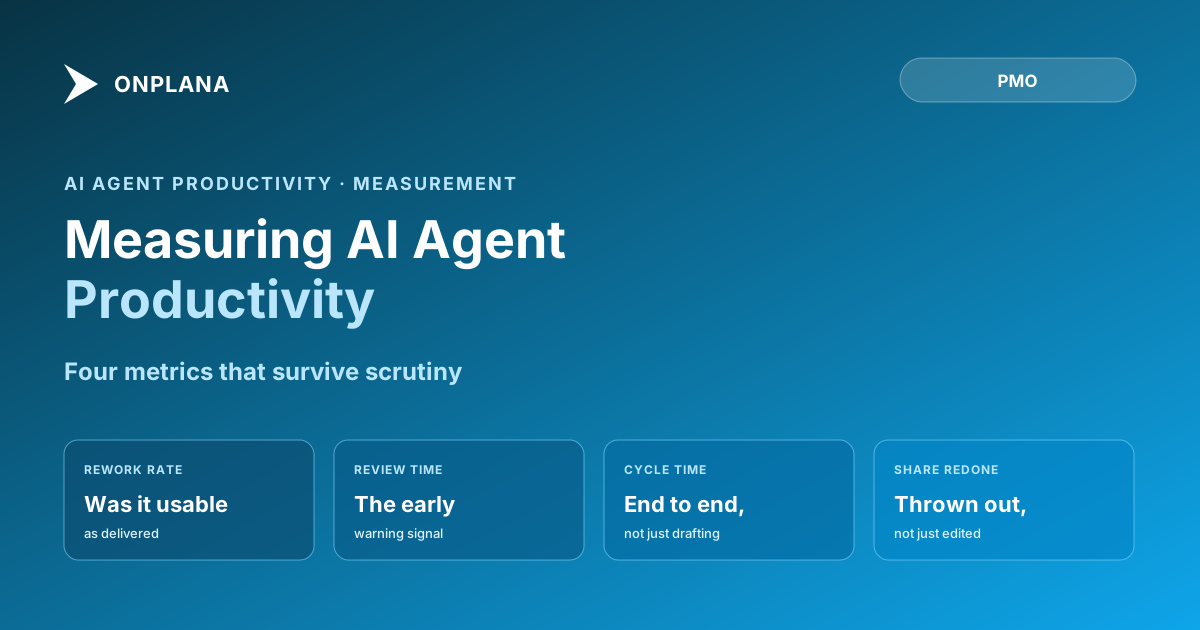
Four metrics survive scrutiny where output volume doesn't: rework rate, review time per item, end-to-end cycle time, and the share of agent output a human had to redo before it counted as finished. Each one measures something output volume can't fake, whether the work that came out the other end was actually usable, and each one can move in an unexpected direction, which is exactly what makes it worth tracking instead of a number that only ever goes up.
TL;DR: Track outcomes, not output
- Output volume is the wrong metric. It's the easiest number to inflate and the one least connected to whether work actually shipped.
- Four metrics that hold: rework rate, review time per item, end-to-end cycle time, and the share of output a human had to redo.
- The counter-case is real. A team's visible output can rise while throughput falls, because more output means more review, and review capacity is the actual constraint.
- Review time per item is the early warning. Watch it first as usage scales; it's the number most likely to move the wrong way.
Measuring AI Agent Productivity: Why Output Volume Is the Wrong Metric
Output volume answers "was the agent busy," not "did the team get more done." Those two questions used to have roughly the same answer for a human employee, because a person's time is scarce and producing more usually meant something real was happening. An agent breaks that link completely: it doesn't tire, doesn't need a coffee break, and can generate ten drafts in the time a person generates one. None of that says anything about whether those ten drafts were worth reading.
The failure mode this produces is specific and common: a team reports "agent productivity" as tickets closed, comments posted, or words drafted, watches the number climb every week, and only notices six months in that the same team is shipping the same amount of finished work it always did. The volume metric wasn't lying; it just wasn't measuring the thing anyone actually cared about.
The Four Metrics That Survive Scrutiny
Each of these asks a question output volume can't answer, and each one can be tracked with data most teams already have in their project tool.
| Metric | What it actually measures | Why output volume can't replace it |
|---|---|---|
| Rework rate | Share of agent output that needed material edits before it shipped | A high rework rate means the "output" was a rough draft of the real work, not the work itself |
| Review time per item | How long a qualified reviewer needs to check one unit of agent output | Rising review time is the earliest signal that a review process, not the agent, has become the bottleneck |
| End-to-end cycle time | Time from work starting to it actually shipping, including every review pass | The only number that reflects whether the team is faster overall, not just faster at the drafting step |
| Share of work redone | Percentage of agent-touched items a human ultimately did over, not just edited | Distinguishes "needed a light touch-up" from "wasn't usable as delivered," which rework rate alone can blur |
Rework rate and share-redone look similar and measure different things on purpose. A task can have a high rework rate (most items need some edit) and a low redo rate (edits are minor, nothing gets thrown out and restarted), which describes an agent that's a genuinely useful first-draft tool. The inverse, low rework but high redo, describes an agent whose mistakes are rare but expensive, a different problem needing a different fix.
The Counter-Case: Output Up, Throughput Down
The scenario worth planning for isn't the agent failing loudly. It's the one where every visible number looks good. A team connects an agent, watches drafts-per-week triple, and reports a productivity win in the next steering committee. Three months later, end-to-end cycle time, the actual time from a request landing to it shipping, has gotten worse, not better.
What happened is straightforward once you look at review time per item instead of output: the agent tripled the volume of work entering the review queue, and the team's review capacity didn't triple with it. Reviewers who used to check a steady trickle of human-authored work are now the bottleneck for three times the volume, and every item sits longer waiting for a human to look at it. The team is more "productive" by the metric it was tracking and slower by the metric that actually matters to whoever's waiting on the output.
The diagram below shows the split: the vanity metric climbing steadily while the metric that reflects real delivery moves the other way.
How to Start Measuring This Week
None of these four metrics require new tooling if the team's project data already tracks task status and timestamps.
- Tag agent-touched work at the point of assignment. You can't measure a rework rate on work you can't identify as agent-originated later.
- Fix the definition of "rework" before you start counting. Write down what counts (a substantive edit to logic, scope, or a factual claim) and what doesn't (a typo fix, a formatting pass), and audit that definition periodically so it doesn't quietly drift.
- Log review time as its own timestamp, not folded into total cycle time. The gap between "agent finished" and "reviewer approved" is the number that catches the counter-case early.
- Track cycle time end to end, from request to ship, for both agent-touched and human-only work in the same period, so you have a real baseline to compare against rather than an assumption about what used to be normal.
- Review the four together, monthly, not any one in isolation. A good rework rate with a worsening cycle time is the counter-case in progress, and it only shows up if you're looking at both.
Estimating work an agent will do covers the planning-side twin of this problem, replacing a duration estimate with a review-time estimate before the work even starts. Capacity planning when agents do the work covers why review capacity, not agent throughput, is the number that actually bounds what a team can deliver, which is the same constraint this counter-case runs into. And story points and velocity is worth revisiting for any team still sizing agent-touched work against a velocity baseline calibrated on human pace alone.
Output volume will always be the easiest number to put in a slide. The four that actually predict whether an agent is helping, rework rate, review time per item, end-to-end cycle time, and the share of work redone, take more discipline to track and are the only ones that catch the counter-case before it costs a quarter. AI project management ROI covers the same discipline applied to the budget conversation this metric set eventually feeds. More on planning and measuring a team that includes agents is on the Onplana blog.
Frequently asked questions
How do you measure AI agent productivity?
With four metrics, not one: rework rate, review time per item, end-to-end cycle time, and the share of output a human had to redo before it shipped. Output volume alone tells you the agent was busy, not that it helped.
Why is output volume the wrong way to measure AI agent productivity?
Because it's the easiest number to inflate without producing anything more useful. An agent can generate ten drafts an hour; if nine need a rewrite before anyone can use them, the volume number goes up while the team's actual throughput doesn't move at all.
Can a team's output rise while an agent is actually hurting throughput?
Yes, and it's the counter-case that catches teams tracking the wrong number. Visible output (drafts, tickets touched, comments posted) climbs while end-to-end cycle time gets worse, because all that extra output has to be reviewed, and review capacity didn't grow to match it.
Can these productivity metrics be gamed to look better than reality?
Yes, rework rate specifically can be gamed by narrowing what counts as a 'rework': a team under pressure to show good numbers can quietly redefine minor edits as 'not really rework,' which is why the definition needs to be fixed and audited before the metric goes in front of anyone with a reason to want a good number.
What happens to these metrics as agent usage scales up across a team?
Review time per item is the one to watch first, because it's the number most likely to move in the wrong direction as volume triples. If review time per item holds steady while volume grows, the setup is scaling; if it climbs, the review process, not the agent, is now the constraint.
Does a low rework rate mean the agent's output can be trusted without review?
No. A low rework rate describes what happened on past output, not a guarantee about the next item, and treating it as permission to skip review is how a team ends up with something quietly marked done that wasn't. The rate should widen the sampling interval on review, never eliminate review for a task class entirely.
Ready to make the switch?
Start your free Onplana account and import your existing projects in minutes.