Schedule risk
Share of simulated schedules with at least even odds of finishing on time, by plan size
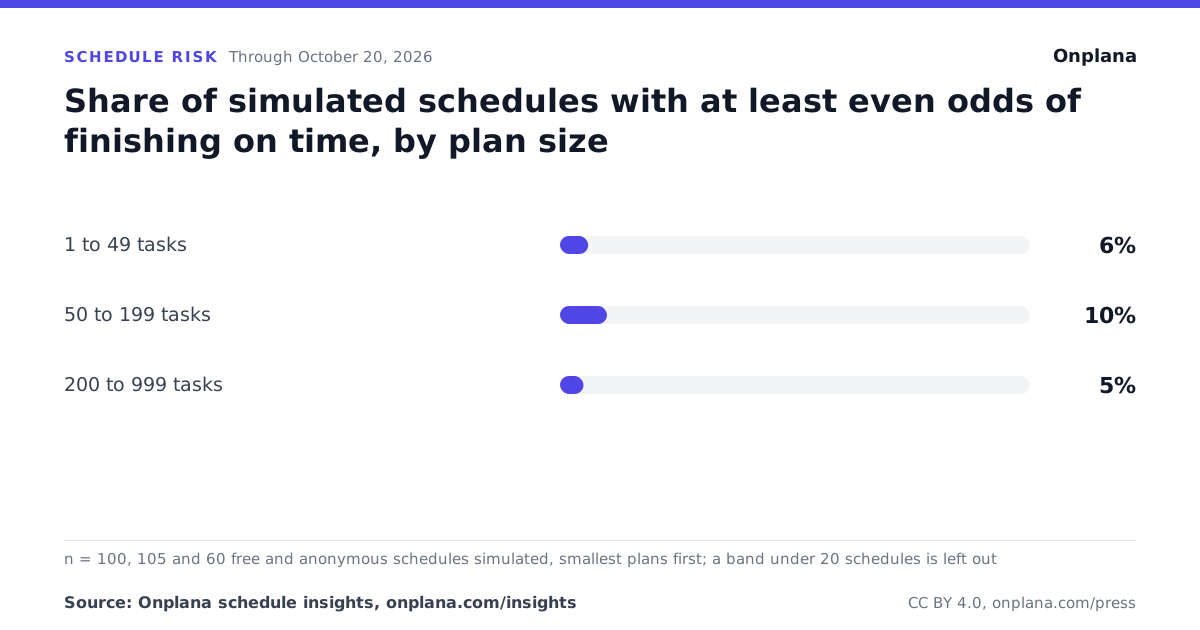
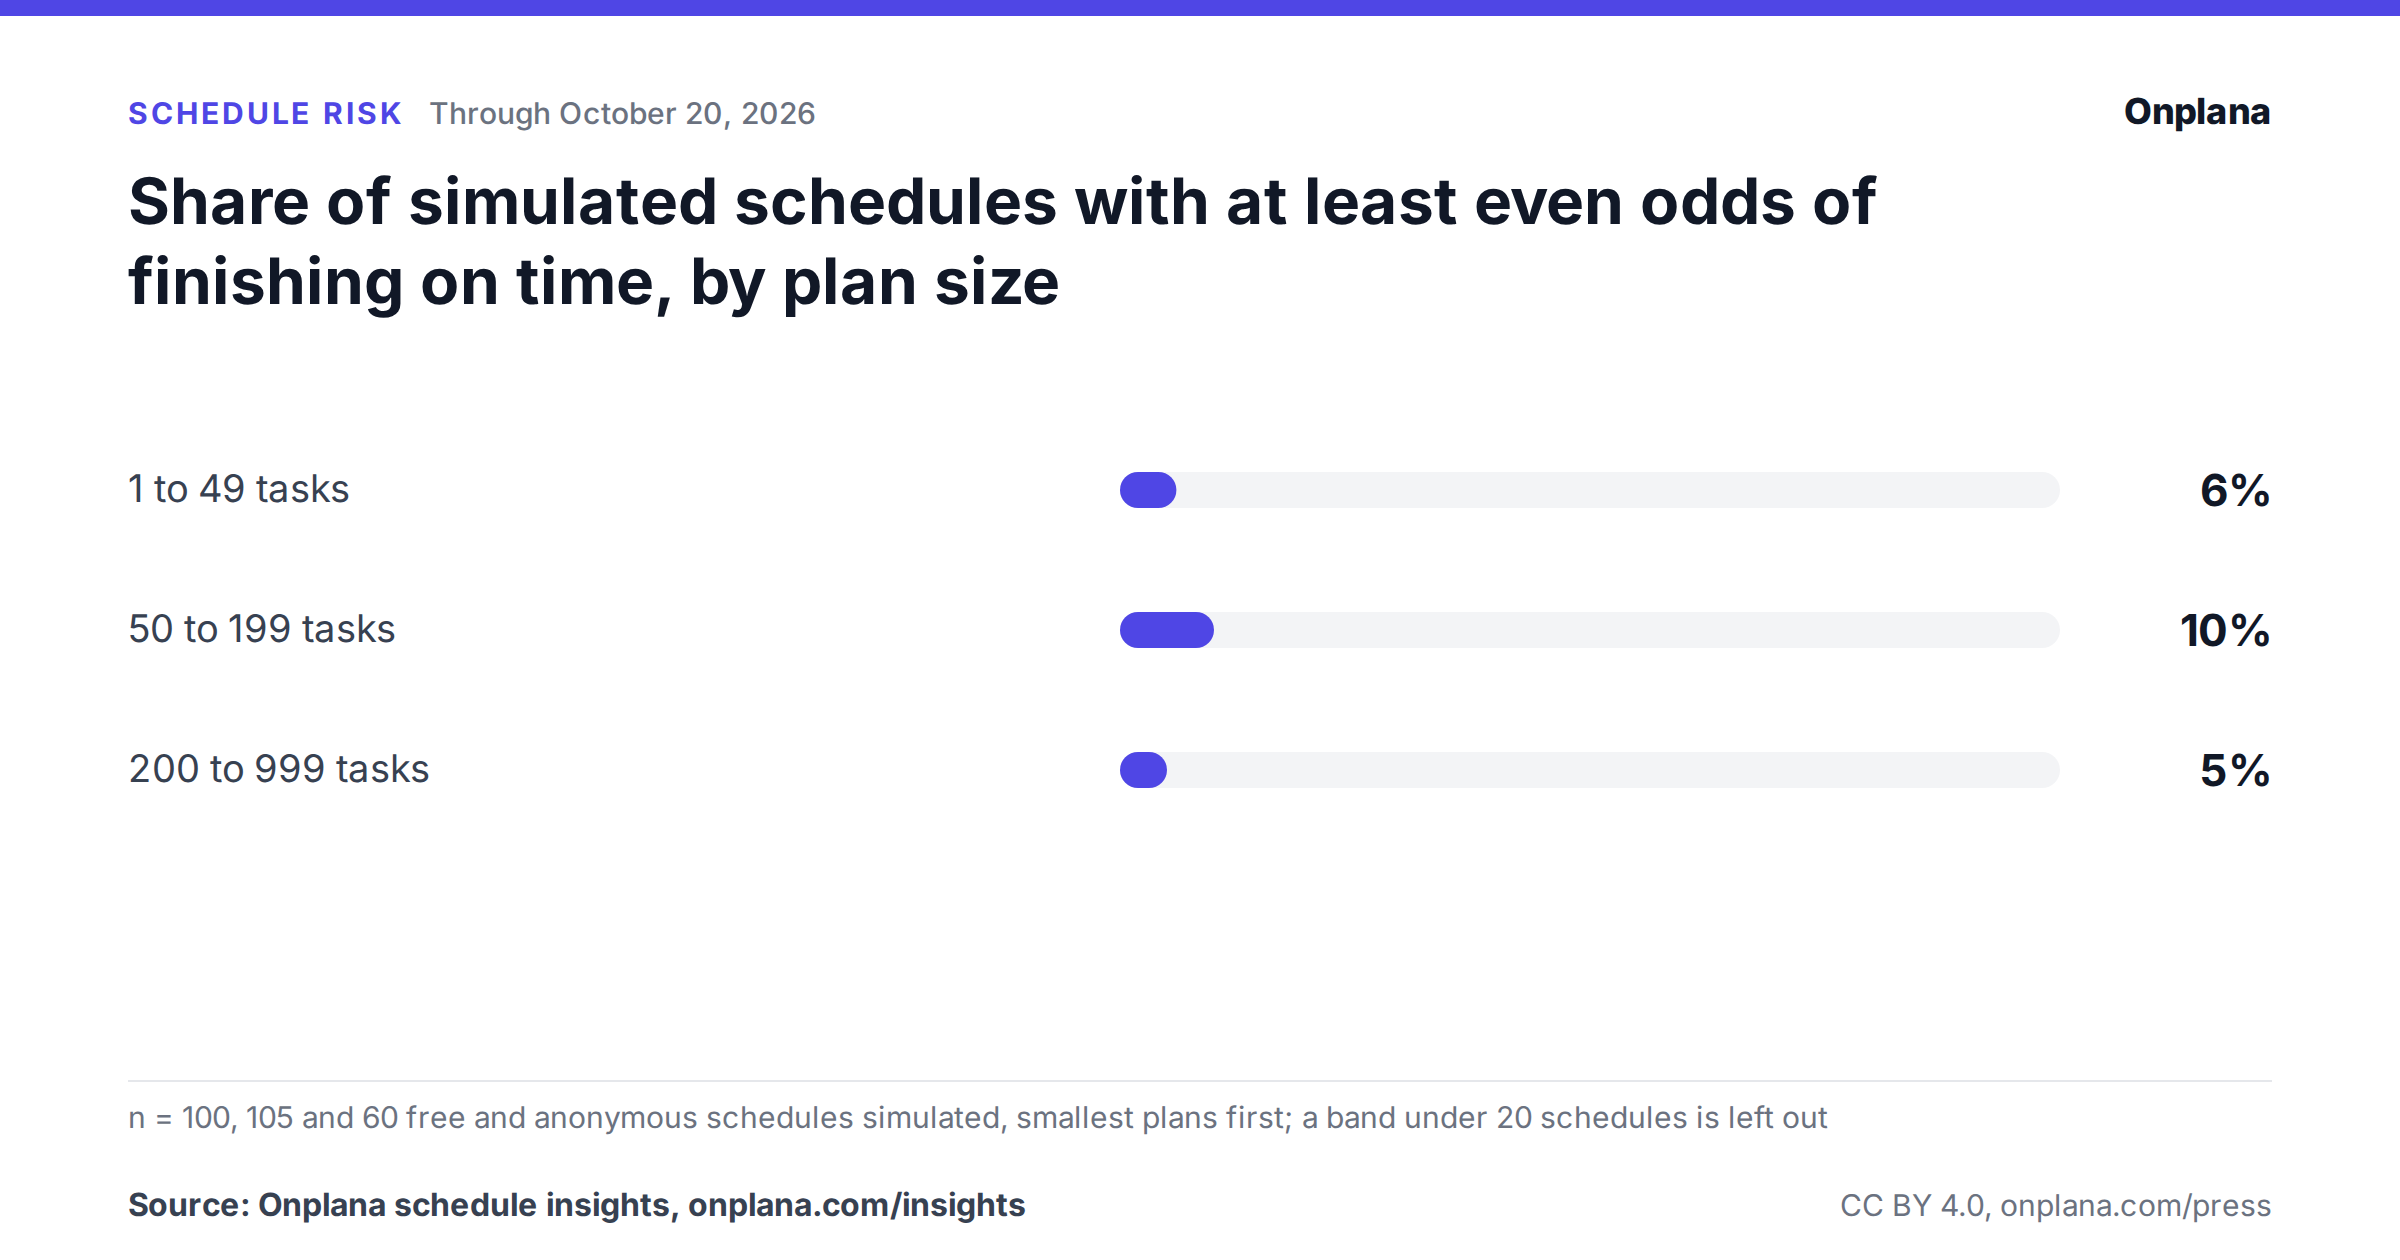
1 to 49 tasks: 6% (n = 100); 50 to 199 tasks: 10% (n = 105); 200 to 999 tasks: 5% (n = 60).
n = 100, 105 and 60 free and anonymous schedules simulated, smallest plans first; a band under 20 schedules is left out.
Every chart is free to republish, in print or online, under Creative Commons Attribution 4.0 (CC BY 4.0). Keep the credit that is inside the image, or write it beside the chart:
Source: Onplana schedule insights, onplana.com/insights
Online, please link the credit to onplana.com/insights.
Embed it
<figure>
  <img src="https://onplana.com/press/charts/on-time-by-plan-size.png" width="1200" height="630" alt="Share of simulated schedules with at least even odds of finishing on time, by plan size">
  <figcaption>Source: <a href="https://onplana.com/insights">Onplana schedule insights</a>, <a href="https://creativecommons.org/licenses/by/4.0/">CC BY 4.0</a></figcaption>
</figure>
More charts from the same data
- 7% of schedules run through the free Schedule Risk Analyzer have at least even odds of finishing by their planned date (Schedule risk)
- The typical simulated schedule finishes 11 days past its planned date at even odds, and 16 days at 80% confidence (Schedule risk)
- 85% of uploaded schedules have no baseline saved (Schedule health report)
- 64% of schedules uploaded to our free tools have at least one task with no links in or out (What the Schedule Health Check finds)
- 45% of uploaded schedules have 50 to 199 tasks (Schedules by plan size)
- Half of the schedules uploaded to our free tools have 98 tasks or fewer (Schedules by plan size)
- 87% of schedules uploaded to our free tools are .mpp or other files not in XML, and 11% are XML (File types uploaded)