6 Schedule Quality Metrics That Beat Percent Complete
Schedule quality metrics like logic density and negative float catch problems percent complete hides. Six numbers to track, with healthy thresholds.
Percent complete tells you how much work is reported done. It says nothing about whether the schedule underneath that number is structurally sound, which is why a project can show 60% complete for months and then miss its date anyway. Schedule quality metrics catch that gap: six measurable properties, logic density, constraint count, negative float, high float, missing predecessors, and duration outliers, that describe the schedule's structure rather than its reported progress.
The direct answer: a healthy schedule keeps logic density above 95%, hard constraints under 5% of tasks, negative float at exactly zero, high float (more than 44 working days) under 5% of incomplete tasks, dangling predecessors under 5%, and duration outliers rare enough that a round number is the exception, not the rule. Any one of these failing is a structural problem a status meeting won't surface, because percent complete doesn't measure structure at all.
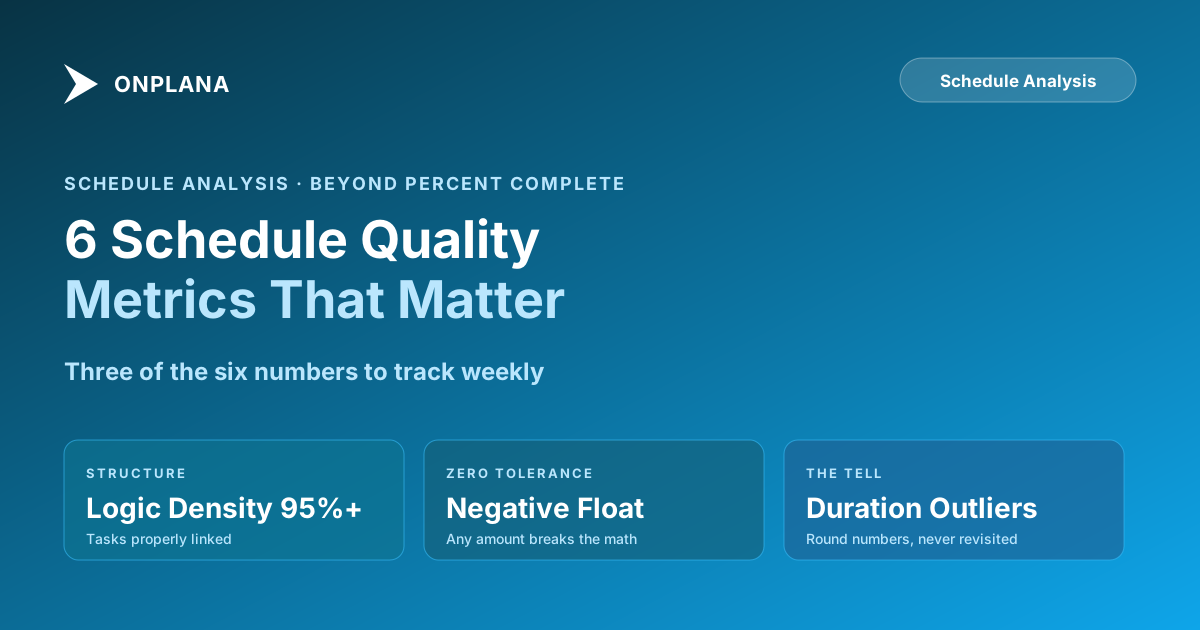
Six numbers describe a schedule's structural health better than percent complete: logic density (target 95%+ of tasks properly linked), constraint count (under 5% hard-constrained), negative float (zero, always), high float (under 5% of tasks past 44 working days of slack), missing predecessors (the dangling-task census that logic density scores), and duration outliers (round-number placeholders like 5, 7, 14, or 30 days). Track them weekly, because a clean schedule at kickoff can pick up all six problems the first time it gets rescheduled under pressure.
The Six Schedule Quality Metrics at a Glance
| Metric | What it measures | Healthy threshold | What a bad number usually hides |
|---|---|---|---|
| Logic density | Share of tasks with both a predecessor and successor | 95% or higher | Tasks invisible to the critical path, so their slip goes unnoticed |
| Constraint count | Share of tasks with a hard date constraint | Under 5% | Dates set by memory or politics, not by the dependency network |
| Negative float | Count of tasks where late finish falls before early finish | Zero | A hard constraint or slipped predecessor has broken the schedule's own math |
| High float | Share of incomplete tasks with more than 44 working days of slack | Under 5% | A task with no real deadline pressure, often mis-sequenced or padded |
| Missing predecessors | Raw count of tasks with no predecessor link at all | Near zero | The specific tasks driving a bad logic-density score |
| Duration outliers | Tasks with round-number durations (5, 7, 10, 14, 30 days) | Rare, reviewed on sight | A placeholder estimate from kickoff that nobody ever revisited |
Logic Density and Missing Predecessors: Two Views of One Blind Spot
Logic density is the aggregate score: the percentage of unfinished tasks that carry both a predecessor and a successor, so the network can actually calculate a critical path through them. Missing predecessors is the same problem at the task level, the literal list of which tasks are disconnected. A schedule needs both numbers, because logic density tells you whether you have a problem and the missing-predecessors list tells you which tasks to fix.
This is also the single most common structural failure in real schedules. Our audit of 500 Microsoft Project files found dangling tasks, tasks with no predecessor, no successor, or both, in 83% of them, far past the 5% threshold DCMA's own methodology treats as a pass. A disconnected task doesn't appear on the critical path even when it should, so it can slip for weeks before anyone notices, because nothing in the schedule's math is watching it.
Constraint Count: When Dates Override Logic
A hard constraint, Must Start On or Must Finish On, tells the schedule to ignore its own dependency math and use a fixed date instead. A few of these are normal: a vendor delivery date, a regulatory filing deadline. A schedule where more than 5% of tasks carry one isn't really being driven by its dependency network anymore; it's a collection of fixed dates with dependency arrows decorating it. That matters because a constrained schedule can look identical to a logic-driven one right up until a predecessor slips and the successor's hard-coded date doesn't move to match, silently breaking the schedule's own claim to represent reality.
Negative Float and High Float: The Two Float Failures
Negative float means a task's late finish date is earlier than its early finish date, a state that's only mathematically possible when a hard constraint or an already-slipped predecessor has broken the schedule's own logic. It's a zero-tolerance metric for exactly that reason: there's no acceptable amount of negative float, because any amount means the schedule's math no longer agrees with itself.
High float is the opposite failure and easier to miss because it looks harmless. A task with more than 44 working days of slack, DCMA's own threshold, either has no real deadline pressure or is mis-sequenced in a way that hides genuine risk behind an artificial cushion. More than 5% of incomplete tasks carrying that much float usually means the schedule was built loosely rather than estimated carefully, which shows up later as a critical path that shifts unpredictably every time someone finally re-baselines.
The diagram below shows where each of the six metrics sits relative to the schedule's dependency network, since three are network-structure problems and three are date or duration problems.
Duration Outliers: The Round-Number Tell
A task estimated at 5, 7, 10, 14, or 30 days is usually not the product of analysis; it's a placeholder somebody typed during a kickoff meeting and never came back to revise. The same 500-schedule audit found at least one suspicious round-number duration in 62% of files. The fix isn't banning round numbers outright, since some real estimates genuinely land on one. It's flagging them for a second look and asking the task owner whether the number reflects analysis or a guess made under time pressure, which is a five-minute conversation that a duration-outlier report makes possible and a Gantt chart alone does not.
Tracking All Six Without Building a New Report
The six metrics come from the same source data a Gantt chart already has: task durations, predecessor and successor links, constraint types, and calculated float. None require a new data source, only a structural pass across the schedule that a status meeting doesn't normally run. The free Schedule Health Check runs exactly this pass against an uploaded .mpp, MSPDI XML, or .xer file and reports each of the six by name, with the specific tasks behind a bad number rather than just the aggregate score. Pair it with a weekly cadence rather than a one-time baseline check, since a schedule that starts clean can accumulate constraints and dangling tasks every time it gets rescheduled under deadline pressure, and the Critical Path Method explainer covers the float and network mechanics these metrics are built on if any of the terms above need a fuller walkthrough.
Run the free Schedule Health Check Upload your
.mpp, MSPDI XML, or.xerfile and get all six metrics scored against these same thresholds, with the specific tasks behind each finding. No signup required. → Open the Schedule Health Check
The rest of the Onplana blog covers schedule analysis beyond these six metrics, including the formal DCMA 14-point assessment these thresholds are drawn from.
Microsoft Project™ is a trademark of Microsoft Corporation. Onplana is not affiliated with Microsoft.
Frequently asked questions
What are schedule quality metrics?
Measurable properties of a schedule's structure, separate from percent complete: logic density, constraint count, negative float, high float, missing predecessors, and duration outliers. Each one can flag a schedule in trouble before any task is actually late.
What is a healthy logic density score?
95% or higher, meaning fewer than 5% of unfinished tasks lack a predecessor or successor. Our own audit of 500 real schedules found 83% had at least one dangling task, far past that threshold.
What counts as a bad constraint count?
More than 5% of tasks carrying a hard constraint like Must Start On or Must Finish On. Hard constraints override the dependency logic they sit on top of, so a schedule full of them isn't really being driven by its network at all.
Why is any negative float a serious problem?
Negative float means a task's late finish date falls before its early finish date, which is only mathematically possible when a hard constraint or an already-slipped predecessor has broken the schedule's own math. It's a zero-tolerance metric: any negative float number means something in the schedule is lying to you.
What is a duration outlier?
A task duration that looks like a placeholder rather than an estimate, most often a round number: 5, 7, 10, 14, or 30 days. We found at least one in 62% of the schedules we audited, almost always an estimate nobody revisited after the kickoff meeting.
How often should these metrics be checked?
Weekly, alongside the status update, not once at baseline. A schedule with clean numbers at kickoff can accumulate hard constraints and dangling tasks every time someone reschedules under pressure, so the metrics need to be watched as the schedule changes, not just when it's first built.
Ready to make the switch?
Start your free Onplana account and import your existing projects in minutes.