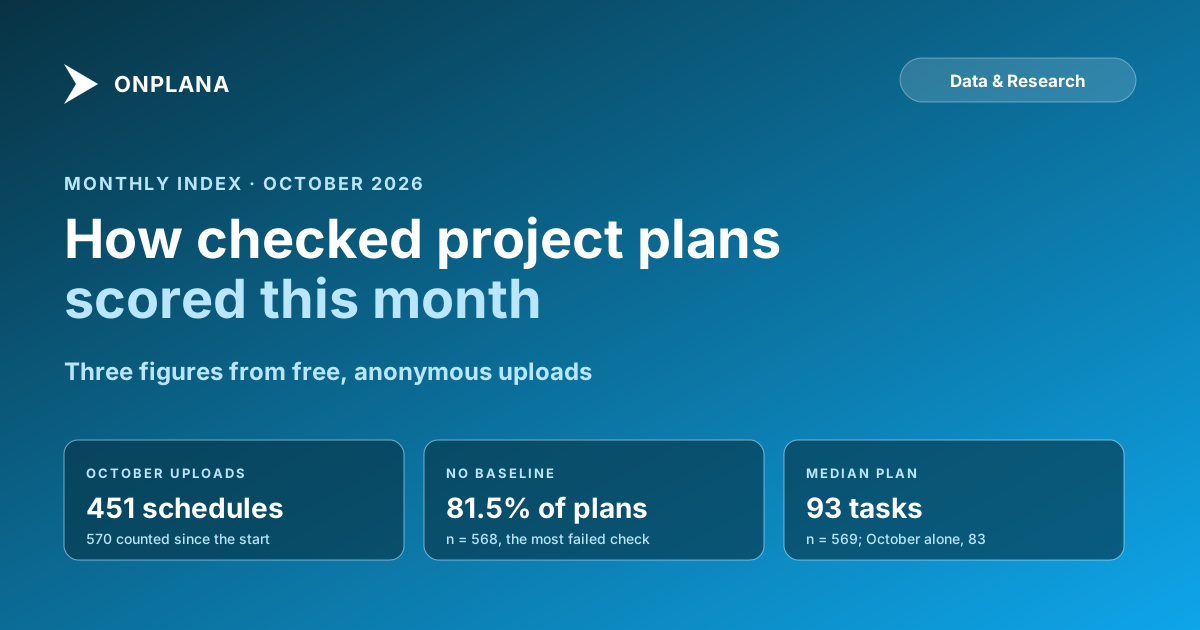
Schedule Health Index, October 2026
The Schedule Health Index for October 2026: 451 free plan uploads, the three DCMA checks most plans fail, median plan size, and the baseline gap narrowing.
In short. In October 2026, 451 project schedules went through the free Schedule Health Check. Across all 570 plans counted so far, 81.5% have no baseline, 47.9% leave more than 5% of their tasks with no link in either direction, and 39.5% constrain more than 5% of their tasks. The median plan has 93 tasks. The one thing that moved: the share of October's plans with no baseline fell to 78.7%, from 89.4% in July to September.
The Schedule Health Index is a monthly read of what real project schedules look like when someone checks them for free. It is not a survey and it is not a sample anyone chose. It is the count of every free and anonymous plan uploaded to Onplana's free tools, reduced to shares and medians, with the number of plans behind each figure printed next to it. The live figures, updated nightly, are on Onplana's schedule insights pages; this post freezes them for one month and says what they mean for a scheduler.
This first edition covers October 2026. Its figures were read from the published snapshot taken at 00:40 UTC on 1 November 2026.
What does the Schedule Health Index measure?
The Schedule Health Index measures the structural quality of project schedules uploaded to the free Schedule Health Check: whether tasks are linked, whether dates are pinned by constraints, whether a baseline exists, and how large plans are. It does not measure whether a project succeeded.
Three rules govern every number:
- Free and anonymous uploads only. A plan tied to a paid or trialing organization is dropped before anything is counted.
- Counts only. The figures are shares and medians. No file, task or company name is ever read into them.
- A floor of 20. Any figure built from fewer than 20 plans is left out, never estimated. That is why some checks in the schedule health report appear only once enough plans stand behind them.
Each figure below carries its n, the number of plans it was computed over. The n differs slightly from figure to figure because a check is only counted for plans where it could run: a pasted list, for example, has no constraint data to read.
How many plans were checked in October 2026?
In October 2026, 451 schedules were checked with the free Schedule Health Check. That is the month's n. Since counting began, the total is 570 plans, and the source and DCMA figures in this edition are read over that full total, because the published snapshot reports them cumulatively.
The files are overwhelmingly Microsoft Project files. Of the 570 plans:
| Source | Share of plans (n = 570) |
|---|---|
| Microsoft Project .mpp | 86.8% |
| XML export | 10.5% |
| Excel workbook | 1.9% |
| CSV | 0.5% |
| Pasted list | 0.2% |
The skew matters when you read everything that follows. These are mostly plans built in Microsoft Project, by people curious enough about their plan's quality to upload it. A plan that was never in doubt is less likely to be in the set.
Which DCMA checks do most plans fail?
Most uploaded plans fail on the baseline, then on logic, then on constraints. Those are three of the fourteen checks in the DCMA 14-point schedule assessment, the US Defense Contract Management Agency's standard test of a schedule's structure, described in plain terms in our walkthrough of the DCMA 14-point assessment and in Deltek's summary of the 14 points.
The diagram below shows the share of plans that pass each of the three.
Read as pass rates, over all 570 plans counted to 1 November 2026:
- Baseline: 18.5% pass (n = 568). 81.5% of plans have no baseline saved at all. Without one, DCMA's baseline execution index has nothing to measure against, so the plan cannot be judged on whether work finishes when it was promised.
- Logic: 52.1% pass (n = 564). 47.9% of plans leave more than 5% of their tasks with neither a predecessor nor a successor. DCMA's threshold is 5% of tasks missing either link, so this count is a lower bound on the real failure rate: a task with a predecessor but no successor fails DCMA and is not counted here. At the extreme, 12.4% of plans with two or more tasks have no dependency link at all (n = 558).
- Constraints: 60.5% pass (n = 565). 39.5% of plans constrain more than 5% of their tasks. DCMA counts only hard constraints against its 5% threshold, while this count includes soft ones too, so it is an upper bound on the real failure rate.
Onplana Schedule and the online MPP viewer run all fourteen checks on the plans opened in them. Their per-check results join the insights pages once each check has 20 plans behind it; none has yet, so none is quoted here.
Why is a missing baseline the most common failure?
A missing baseline is the most common failure because saving one is a separate, deliberate step that nothing in a scheduling tool forces. A plan can be fully linked, resourced and shared without ever having its dates frozen, and most of the plans in this index were.
The cost shows up later. Without a baseline, a plan can say where the work is today but not how far it has moved. Every slip looks like the plan. The fix takes a minute: save a baseline once the sponsor approves the dates, and save a new one only when approved scope changes. Our guide to baseline management covers when to freeze and when not to.
How large is the median project plan?
The median uploaded plan has 93 tasks (n = 569). Half of all plans are smaller than that, which puts the typical plan well inside what one scheduler can keep linked by hand.
October's plans ran smaller: their median was 83 tasks (n = 450), against 105 tasks (n = 95) in July to September. Plan size matters for the other figures. On the plan size page, the share of unlinked tasks falls as plans grow, and the median slip in the risk figures rises with size, so a shift in the mix of plan sizes moves the other numbers too.
What changed from last month?
The share of plans with no baseline fell. In October 2026, 78.7% of plans checked had no baseline (n = 450). In July to September 2026, it was 89.4% (n = 94).
Two cautions on reading that change. First, the comparison is with the previous quarter, not with September alone: the published snapshot keeps each closed quarter as its own record, and October is the first month of a new one. Later editions compare against the figures frozen here. Second, October brought almost five times as many plans as the whole previous quarter, from a wider mix of people. A different crowd, not better habits, may explain part of the drop.
How likely are these plans to finish on time?
Few of them, if the plan's own logic is taken at its word. In October 2026, 480 free plans went through a Monte Carlo schedule risk run, and only 9.2% of them had at least even odds of meeting their own planned finish (n = 480). The median plan needed 13.5 extra calendar days to reach 80% confidence.
A risk run simulates every task's duration many times over and reads the finish date the plan reaches in half (P50) and in 80% (P80) of the runs. Over all 525 plans run so far, the median P80 slip is 13 days, and it grows with plan size: 35 days for plans of 200 to 999 tasks (n = 111) and 51 days for plans of 1,000 to 4,999 tasks (n = 21). The schedule risk page has the full split, and our explainer on schedule risk analysis covers how to read P50 and P80.
What the index cannot tell you
The index describes the plans people chose to check, not project schedules in general. Four limits apply to every figure in it.
- Self-selection. Someone uploads a plan because they want to know whether it is sound. Plans that nobody doubts, and plans nobody is allowed to share, are under-represented.
- Tool mix. 86.8% of the plans are Microsoft Project .mpp files. The figures say a lot about how Microsoft Project plans are built and little about plans kept in other tools.
- Structure, not outcome. A plan that passes all three checks can still be wrong about how long the work takes. The checks test whether the plan can be trusted to compute a date, not whether the date is right. The risk figures come closer to that question, and they are still a model of the plan, not a record of what happened.
- No project version or industry. The counts do not record which version of Microsoft Project wrote a file, or which industry a plan comes from, so the index cannot split by either.
Read each figure as "this is what checked plans look like", and compare your own plan against it on that basis. A plan that beats the median on every check is in good company; it is not proven sound.
How to use the index on your own plan
The index is most useful as a yardstick. Three checks take under ten minutes in any scheduling tool:
- Look for a baseline. In Microsoft Project, add the Baseline Finish column. If it reads NA on every row, you are in the 81.5%.
- Count unlinked tasks. Filter for tasks with an empty Predecessors column, then an empty Successors column. If either list is longer than 5% of your tasks, the critical path the tool shows you is not reliable.
- Count constraints. Add the Constraint Type column and count every row that is not "As Soon As Possible". Above 5%, the dates are holding the plan up instead of the logic.
For the same checks automated, upload the file to the free Schedule Health Check. Its report includes a "How your plan compares" section that places your plan against the ranges published here, worked out in your browser. To open and fix the plan on your desktop, Onplana Schedule opens .mpp files and runs the DCMA checks beside the Gantt chart.
Method in one line
Free and anonymous uploads only: plans tied to a paid or trialing organization are excluded, only counts are read, and any figure from fewer than 20 plans is left out. Figures were read from the public endpoint behind onplana.com/insights for the snapshot of 1 November 2026, 00:40 UTC. For the problems behind these checks, file by file, see what we found auditing 500 project schedules. The next edition, for November 2026, follows in early December.
Microsoft Project is a trademark of Microsoft Corporation. Onplana is not affiliated with Microsoft.
Frequently asked questions
What is the Onplana Schedule Health Index?
A monthly summary of what free and anonymous project schedules show when they are checked with Onplana's free tools. Every figure comes from the published insights at onplana.com/insights and carries the number of plans behind it.
How many schedules does the October 2026 index cover?
451 schedules were checked with the free Schedule Health Check between 1 October and 1 November 2026, out of 570 checked since the tool started counting.
Which DCMA check do most uploaded plans fail?
The baseline. 81.5% of uploaded plans (n = 568) carry no baseline at all, so the DCMA baseline execution index cannot even be computed for them.
Are paying customers' plans included?
No. Only free and anonymous uploads are counted; a plan tied to a paid or trialing organization is excluded before any figure is computed.
Why are some figures missing from the index?
Any figure built from fewer than 20 plans is left out rather than estimated, so a check with too few plans behind it does not appear.
Can I see how my own plan compares?
Yes. Upload a .mpp or Microsoft Project XML file to the free Schedule Health Check; its report shows where your plan sits against the published ranges, and that comparison runs in your browser.
Ready to make the switch?
Start your free Onplana account and import your existing projects in minutes.